Or How ProxySQL Out-performs Native Aurora Cluster Endpoints
In this blog post, I'll look at how you can use ProxySQL with AWS Aurora to further leverage database performance. My previous article described how easy is to replace the native Aurora connector with ProxySQL. In this article, you will see WHY you should do that. It is important to understand that aside from the basic optimization in the connectivity and connection management, ProxySQL also provides you with a new set of features that currently are not available in Aurora. Just think:
- Better caching
- Query filtering
- Sharding
- Query substitution
- Firewalling
- ... and more
We will cover areas like scalability, security and performance. In short, I think is more than worth it to spend some time and give ProxySQL with AWS Aurora a try.
The tests
I will show you the results from two different kinds of tests. One is sysbench-oriented, the other simulates a more complex application using Java, data object utilization and a Hikari connection pool in the middle as well. For the EC2 and Aurora platform I used:
- Application/ProxySQL T2.xlarge eu-central-1a
- 2 Aurora MySQL 5.7.12 db.t2.medium eu-central-1a
- 1 Aurora MySQL 5.7.12 db.t2.medium eu-central-1b for AZ redundancy
The code for the application is available here, and for sysbench tests here. All the data and configurations for the application are available here. I ran three tests using both bench apps, obviously with Aurora as it comes and with ProxySQL. For the ProxySQL configuration see my previous article. The tests were read_only / Write_only / read_write. For Aurora, I only increased the number of connections and kept the how it comes out of the box approach. Note each test was run at least three times at different moments of the day, and on a different day. The data reported as final is the BEST performing result for each one.
The Results
For the impatient among us, here is a summary table of the tests: Sysbench: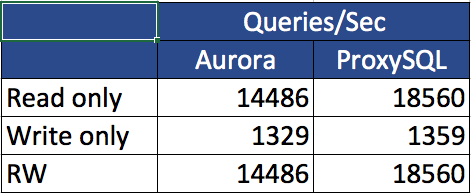
Java App: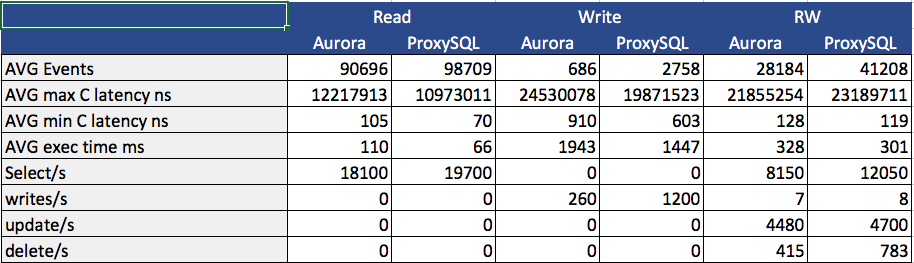
Now if this is enough for you, you can go to the conclusion and start to use ProxySQL with AWS Aurora. If you would like to know a bit more, continue reading. Aside from any discussion on the benchmark tool and settings, I really focused on identifying the differences between the two “connectors”. Given the layer below was exactly the same, any difference is due to the simple substitution of the endpoint.
Sysbench
Read Only
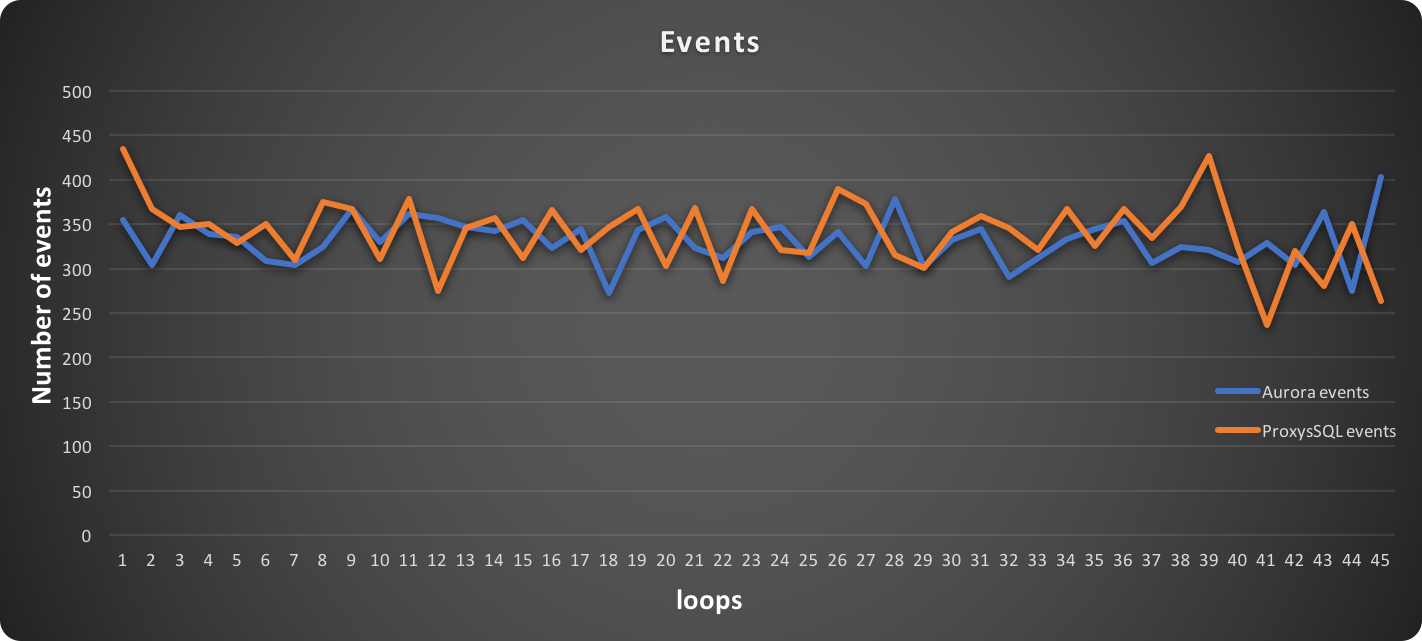
The first image reports the number of events achieved at the time of the test. It is quite clear that when using ProxySQL, sysbench ran more events.
In this graph, higher is better: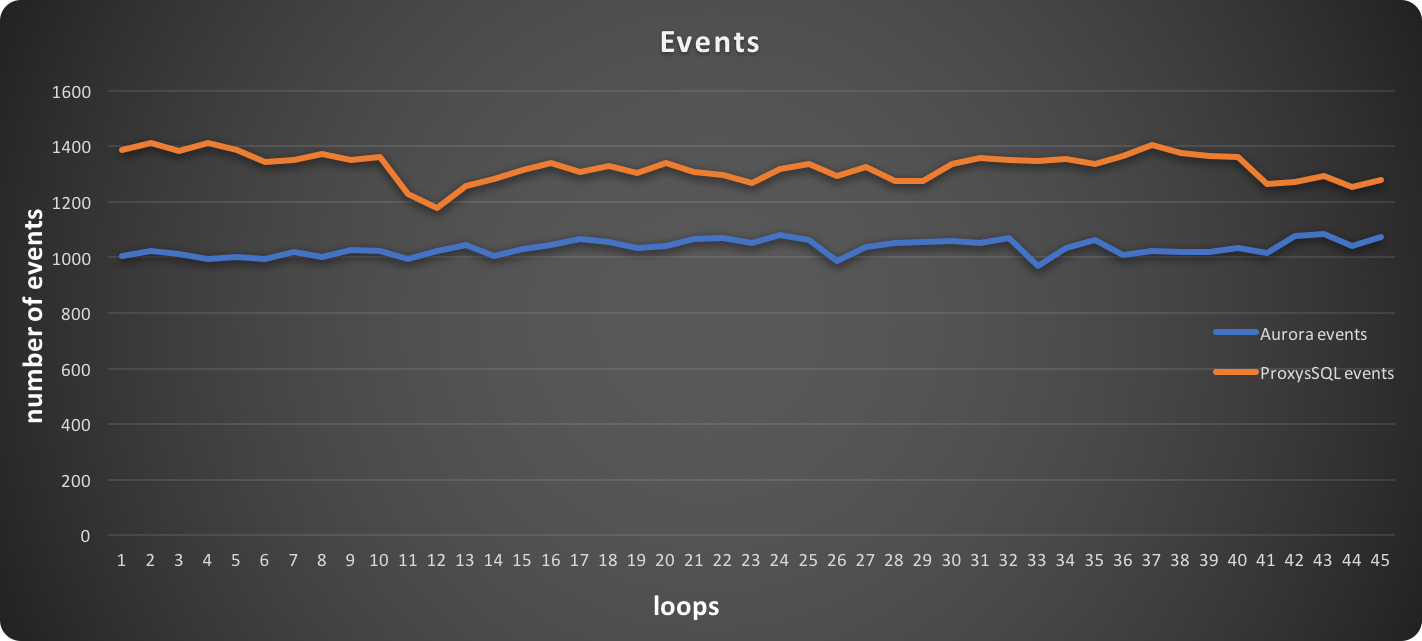
In this graph, lower is better:
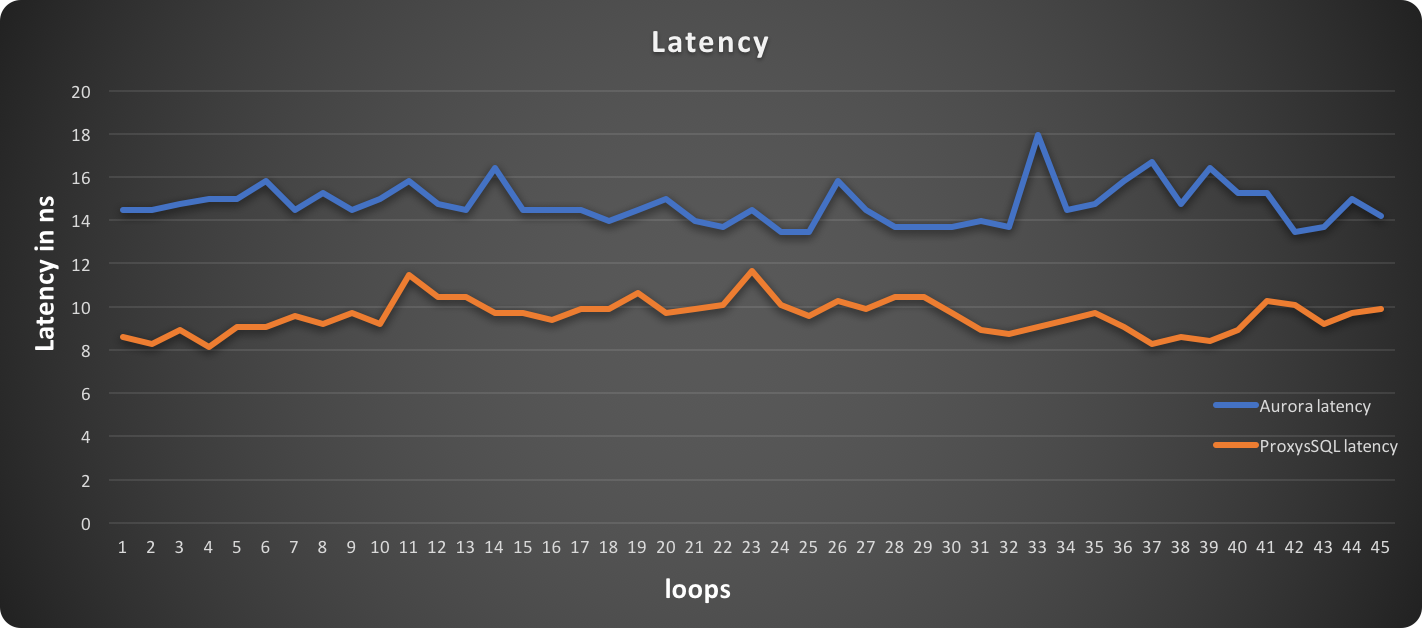
As we can see, the latency when using an Aurora cluster entry point is higher. True, we are talking about milliseconds, but it is not just the value that matters, but also the distribution:
| Aurora cluster endpoint | ProxySQL |
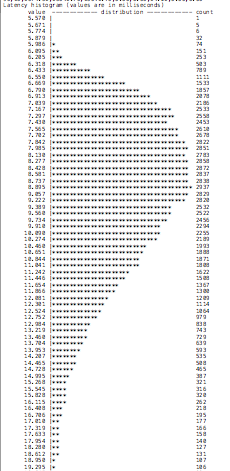 |
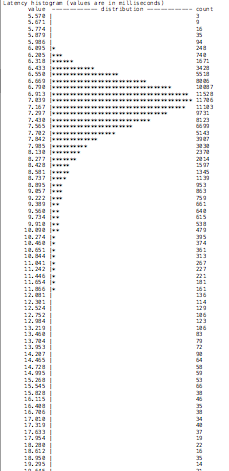 |
An image is worth a thousand words! We can see, the behavior stays constant in analyzing the READS executed, with ProxySQL performing better.
In this graph, higher is better: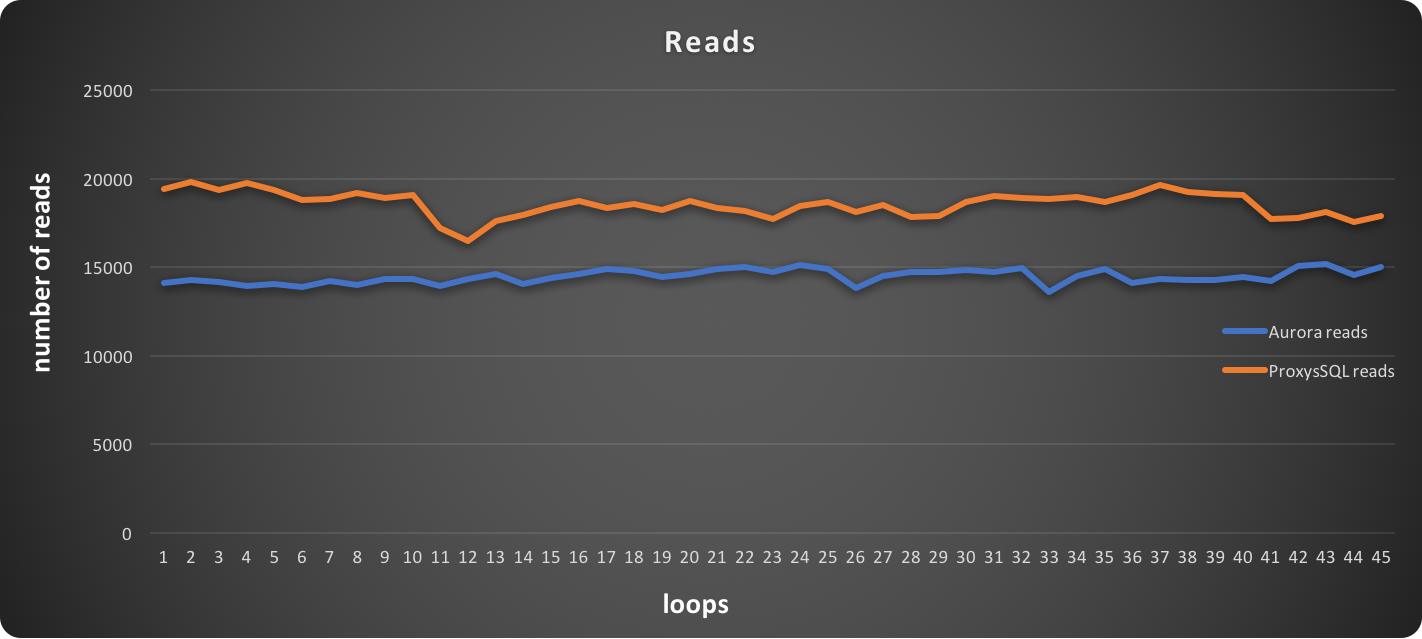
In this graph, higher is better: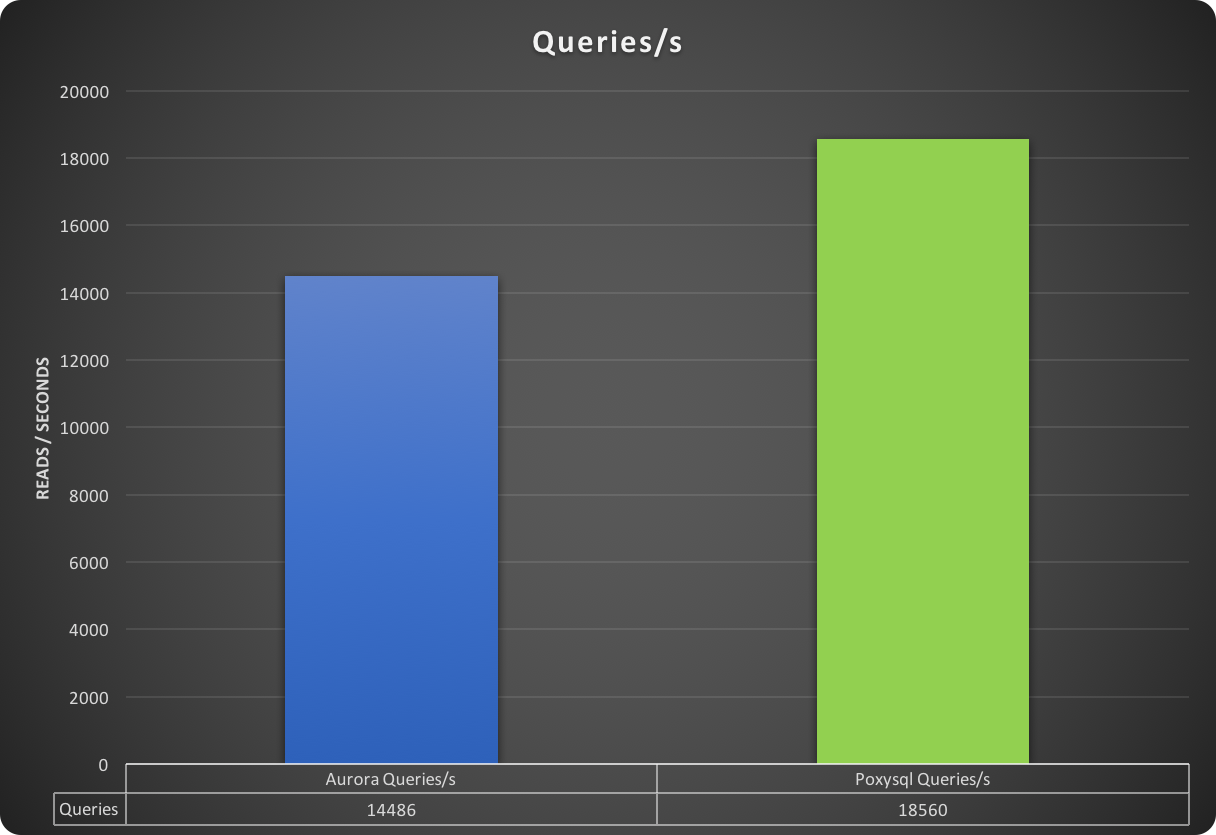
Closing with the number of total queries performed, in which ProxySQL surpassed the Cluster endpoint by ~ 4K queries.
Write Only
For writing, things go a bit different. We see that all lines intersect, and the values are very close one to the other.
I will let the images speak for themselves:
In this graph, higher is better:
In this graph, lower is better: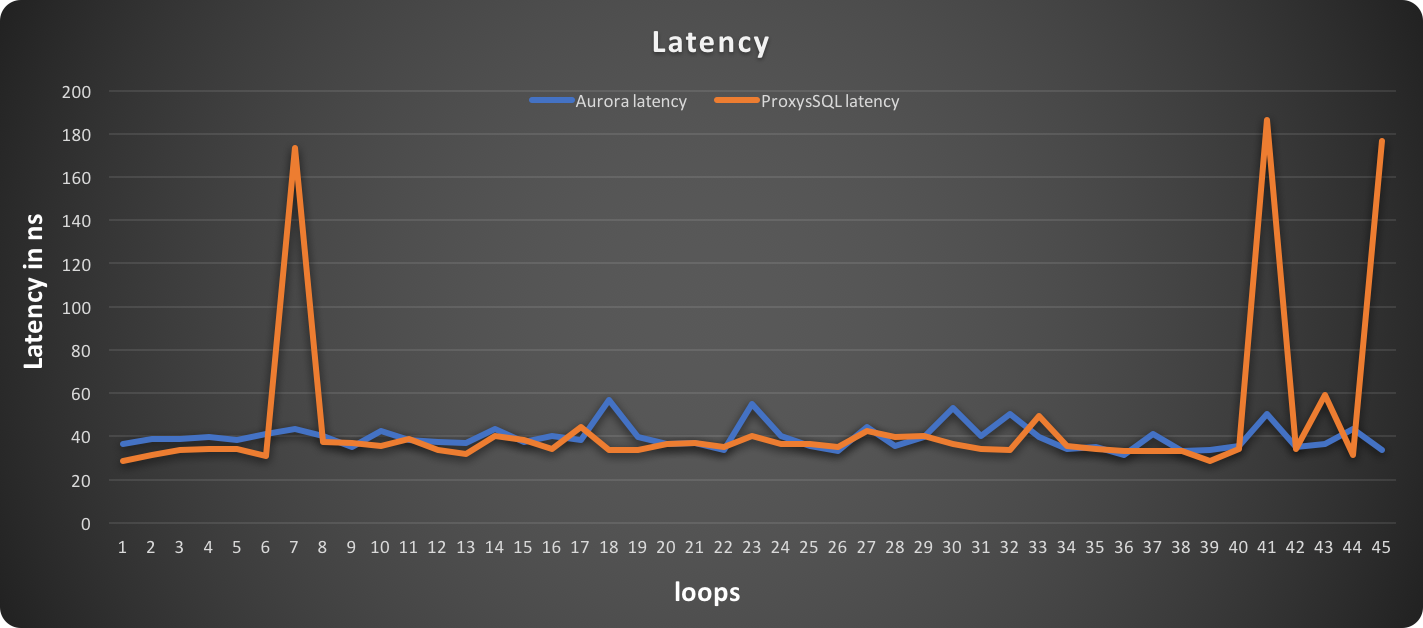
Latency spiked in each ProxySQL test, and it may require additional investigation and tuning.
In this graph, higher is better: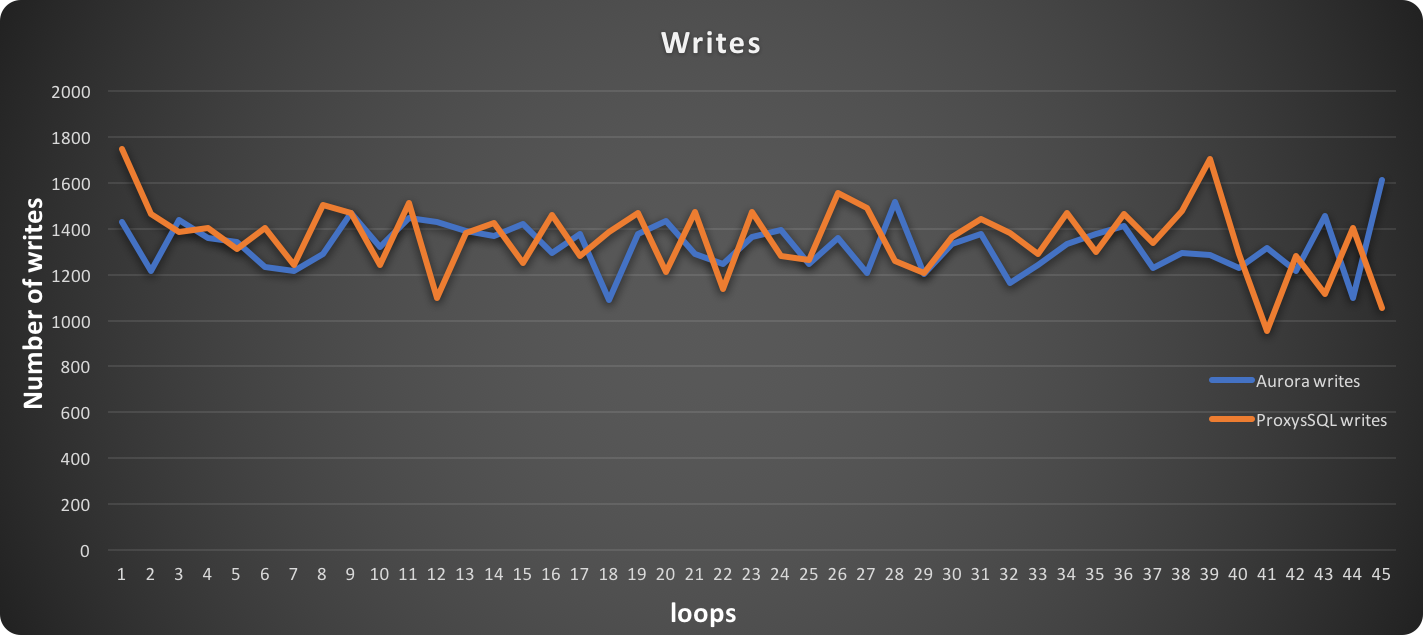
While the rates of writes/sec intersect with each other frequently, in the end ProxySQL resulted in more writes than the native endpoint.
In this graph, higher is better: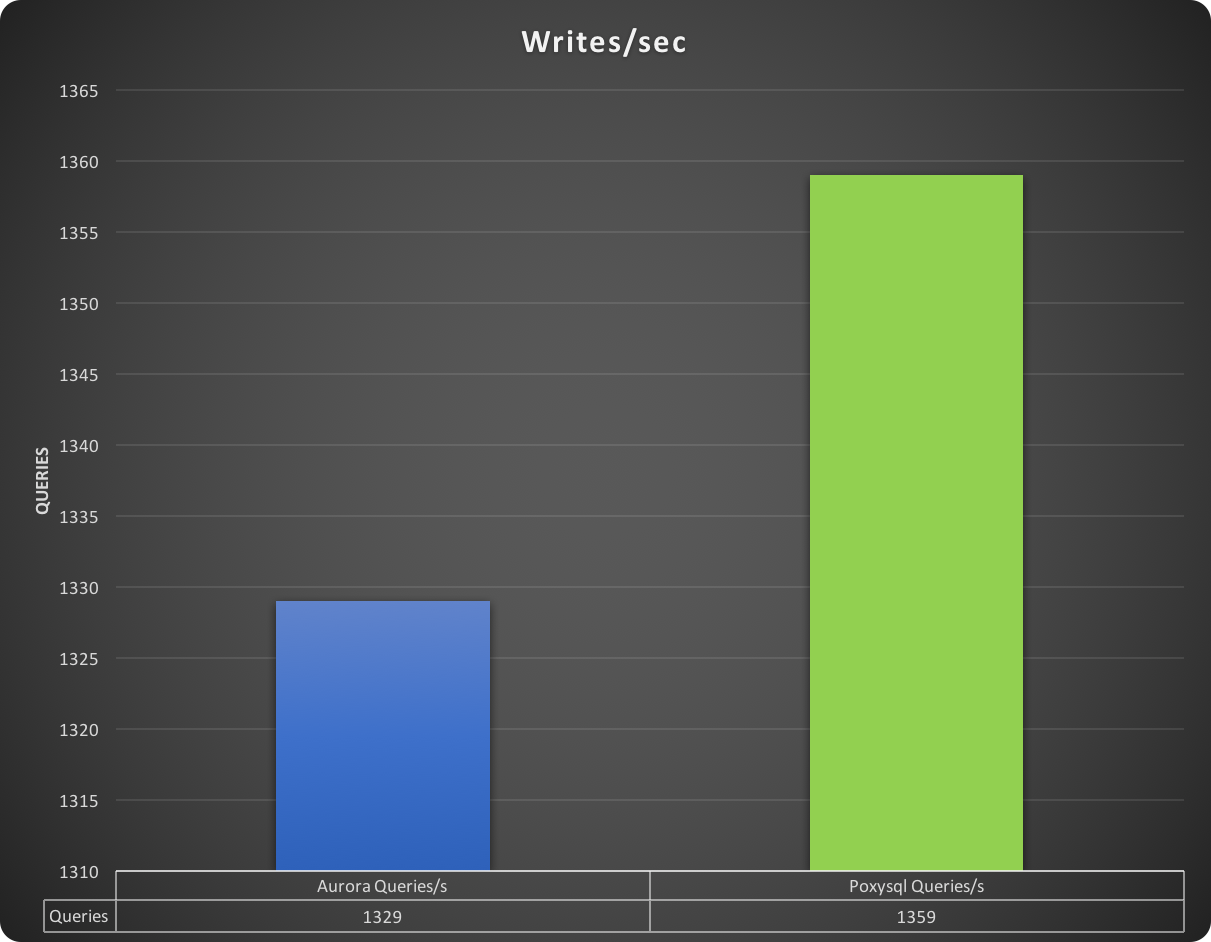
In the end, a difference exists and is consistent across the different test iterations, but is minimal. We are talking a range of 25 - 50 entries in total.
This result is not surprising, and it will be clear why later in the article.
Read and Write
As expected in the read and write test, we see a different situation.
ProxySQL is still performing better than the default entry point, but not by such a big margin as in read-only tests.
In this graph, higher is better: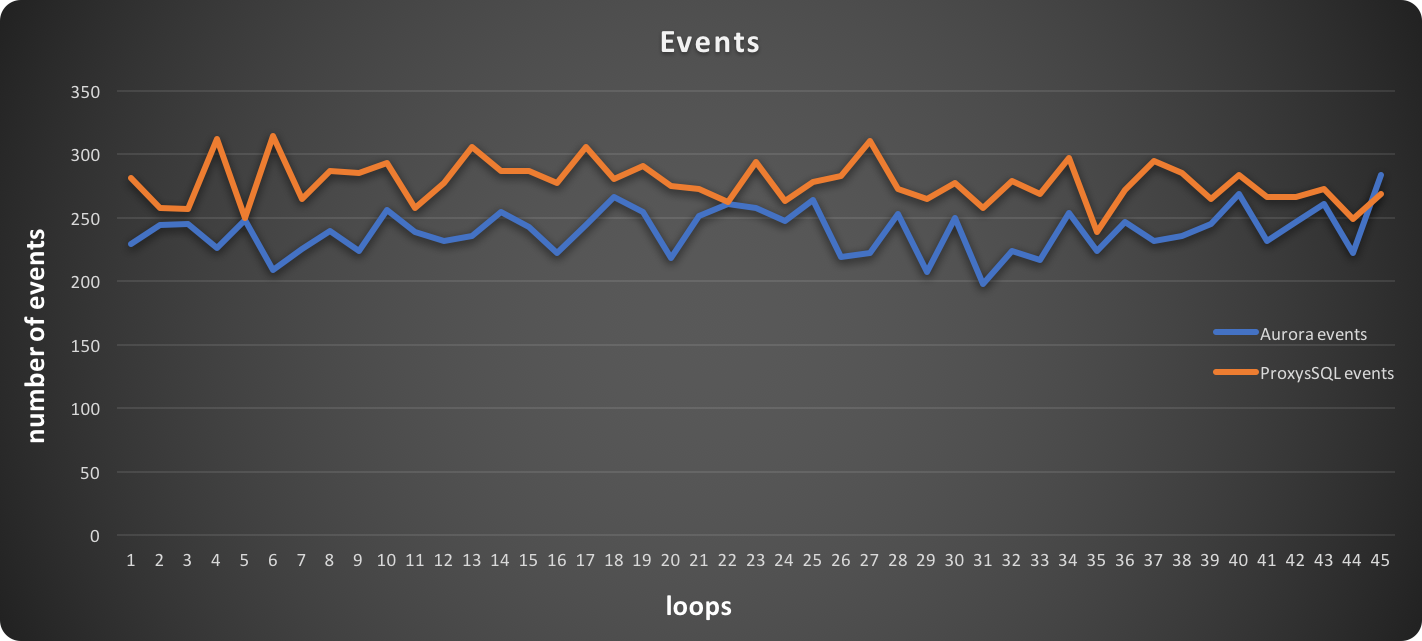
In this graph, lower is better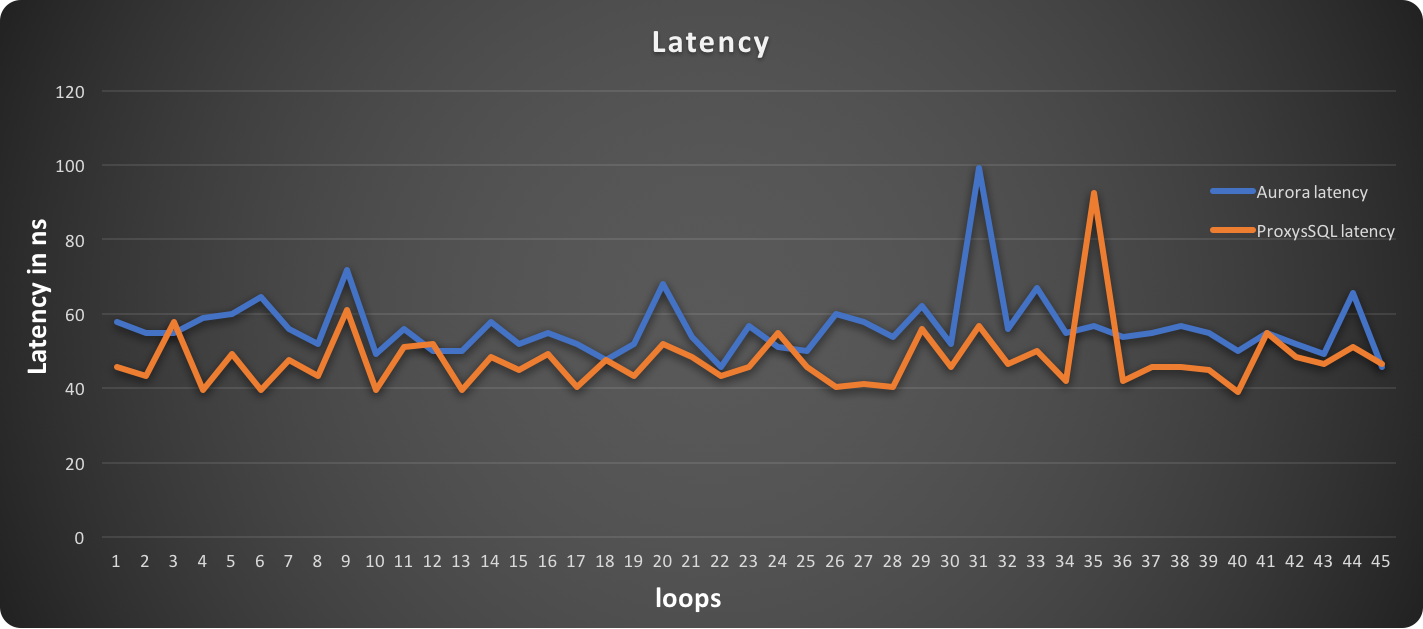
Latency and events are following the expected trend, where read operations are executed more efficiently with ProxySQL and writes are close, but NOT the same as in the write only test. 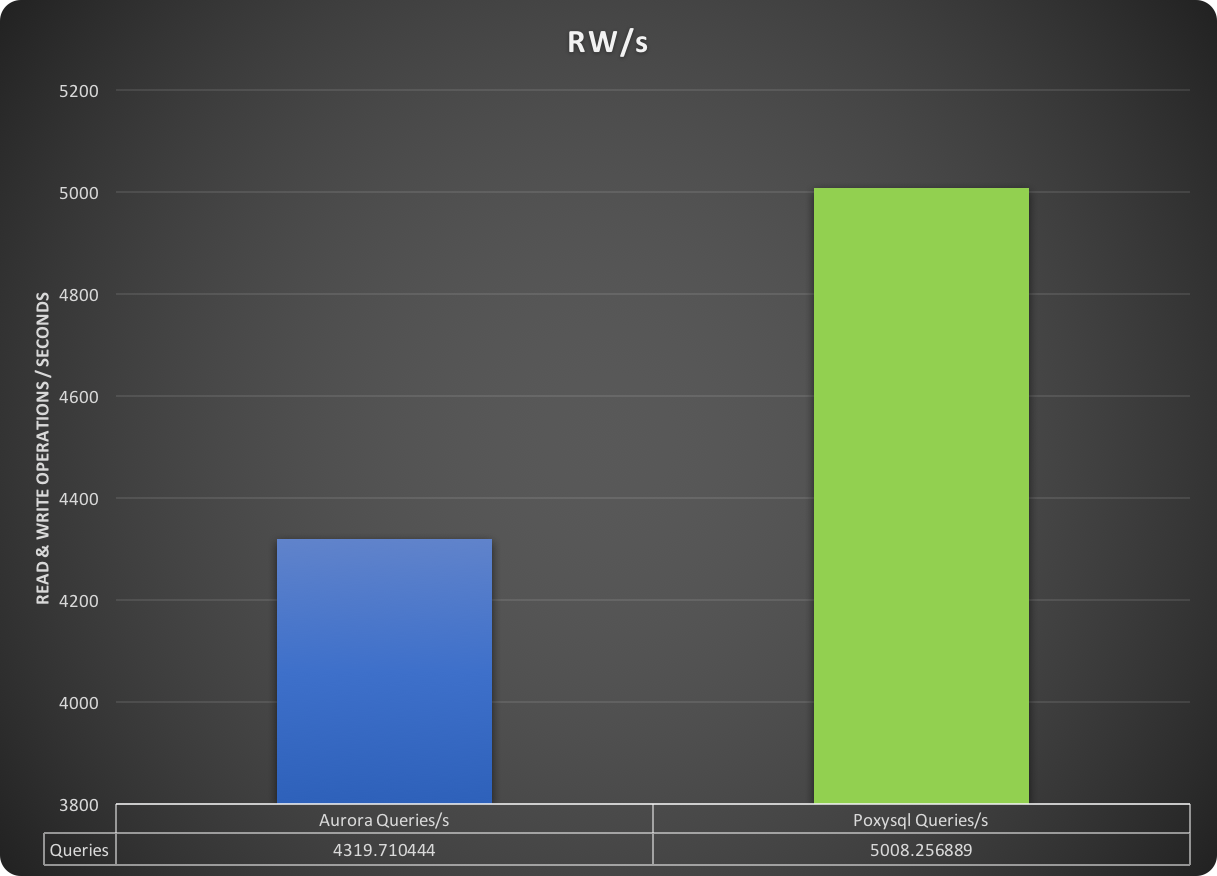
As a result, the number of queries in ProxySQL is approximately 13% better than the default entry point.
Java Application Tests
What about the Java application? First of all, we need to remember that the application used a connection pool mechanism (Hikari), and the connection pool was present in all cases (for both Aurora cluster endpoint or ProxySQL). Given that a small delay in establishing the first connection was expected, you can easily see this in the MAX value of the connection latency. In this graph, lower is better.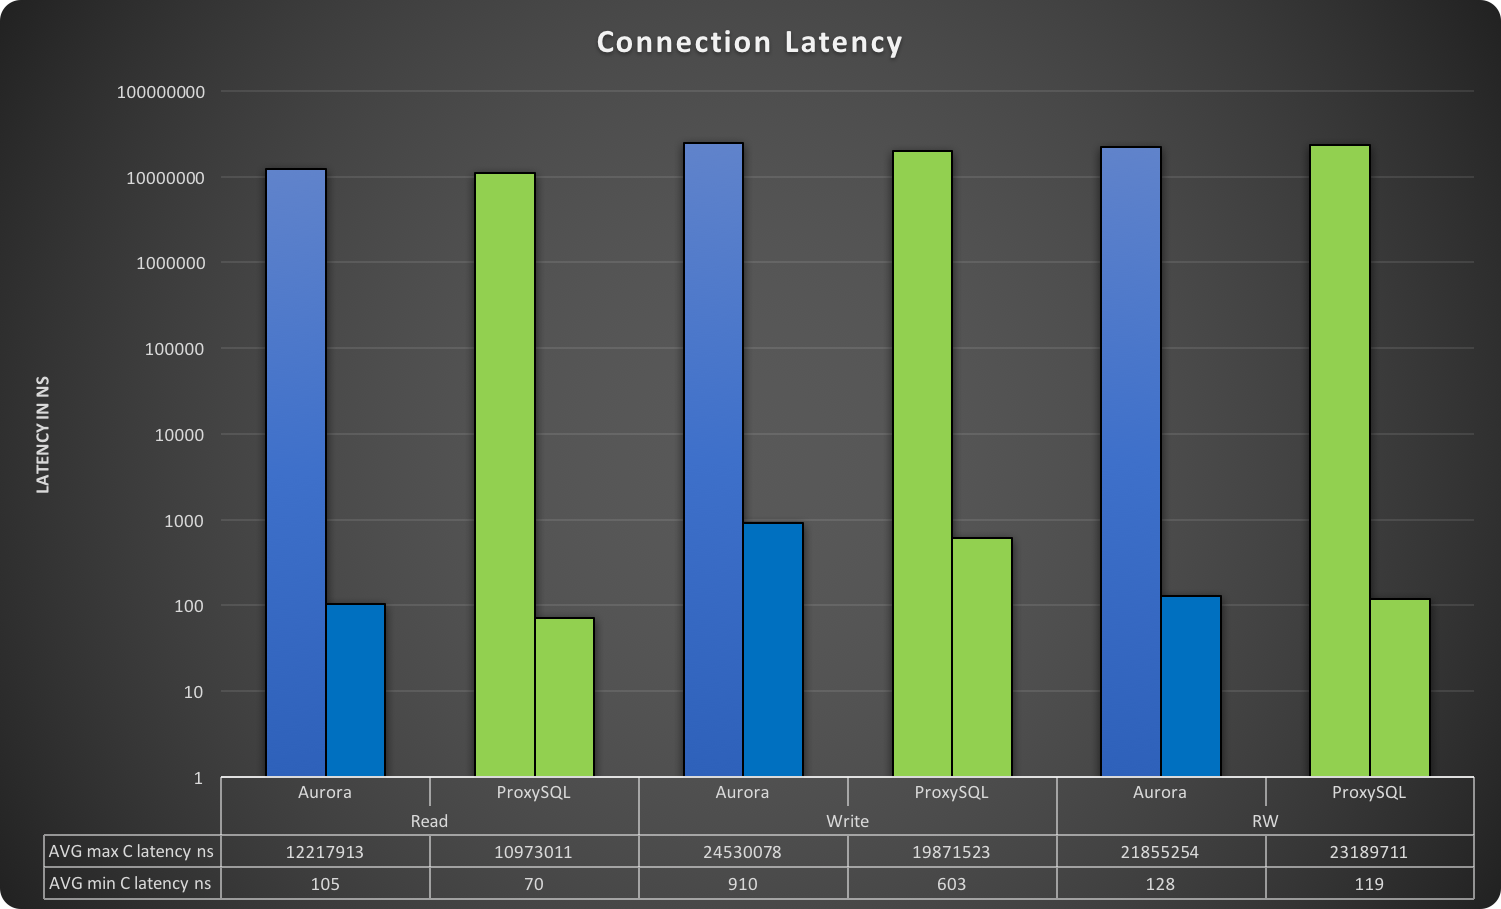
The connection latency reported here is expressed in nanoseconds and is the measure of the time taken by the connection provider to return an active connection to the application from the moment the application requested it. In other words, how long the HikariCP is taking to choose/check/return an open connection. As you can see, the MAX value is drastically higher, and this was expected since it is the connection initialization. While not really interesting in terms of performance, this value is interesting because it gives us the dimension of the cost in the CP to open a new connection, which in the worse case is 25 milliseconds. As the graphs show, ProxySQL manages both cases (first call, reassignment) more efficiently.
In this graph, higher is better.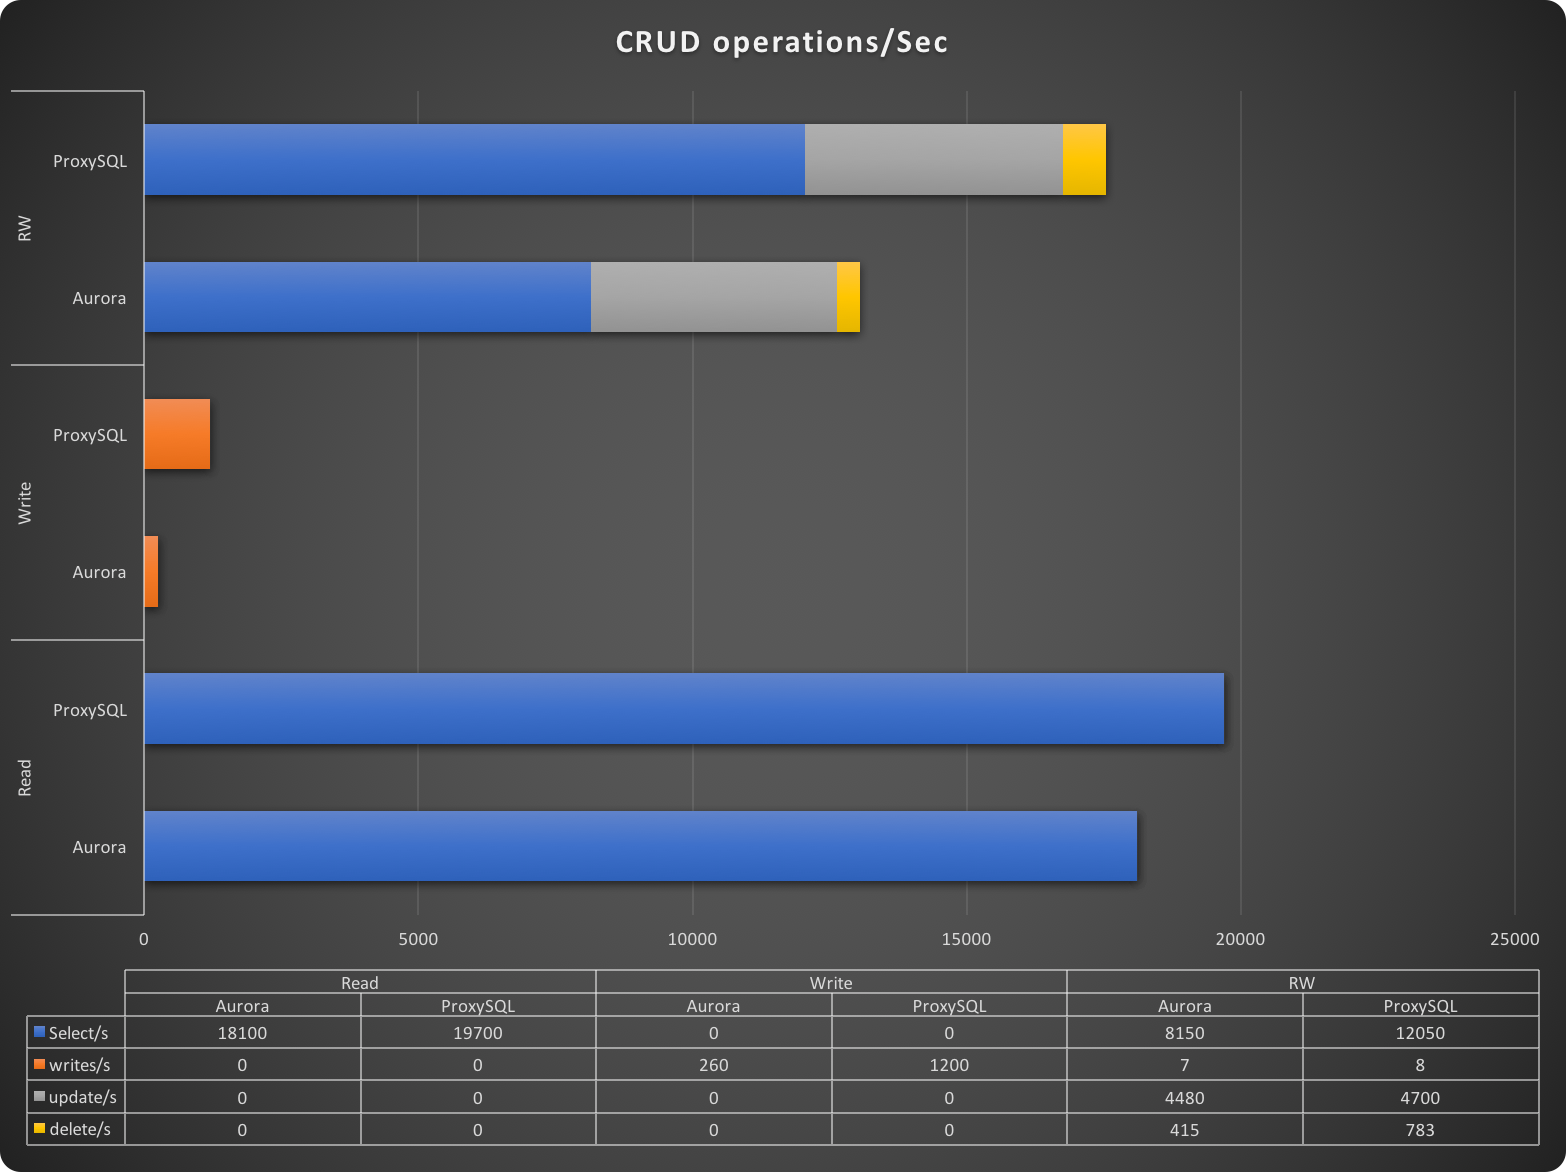
In the CRUD summary table, we can see the number of SQL commands executed per second for each CRUD action and for each test. Once more we can see that when using ProxySQL, the application performed much better and significantly executed more operations (especially in the R/W test).
In this graph, higher is better.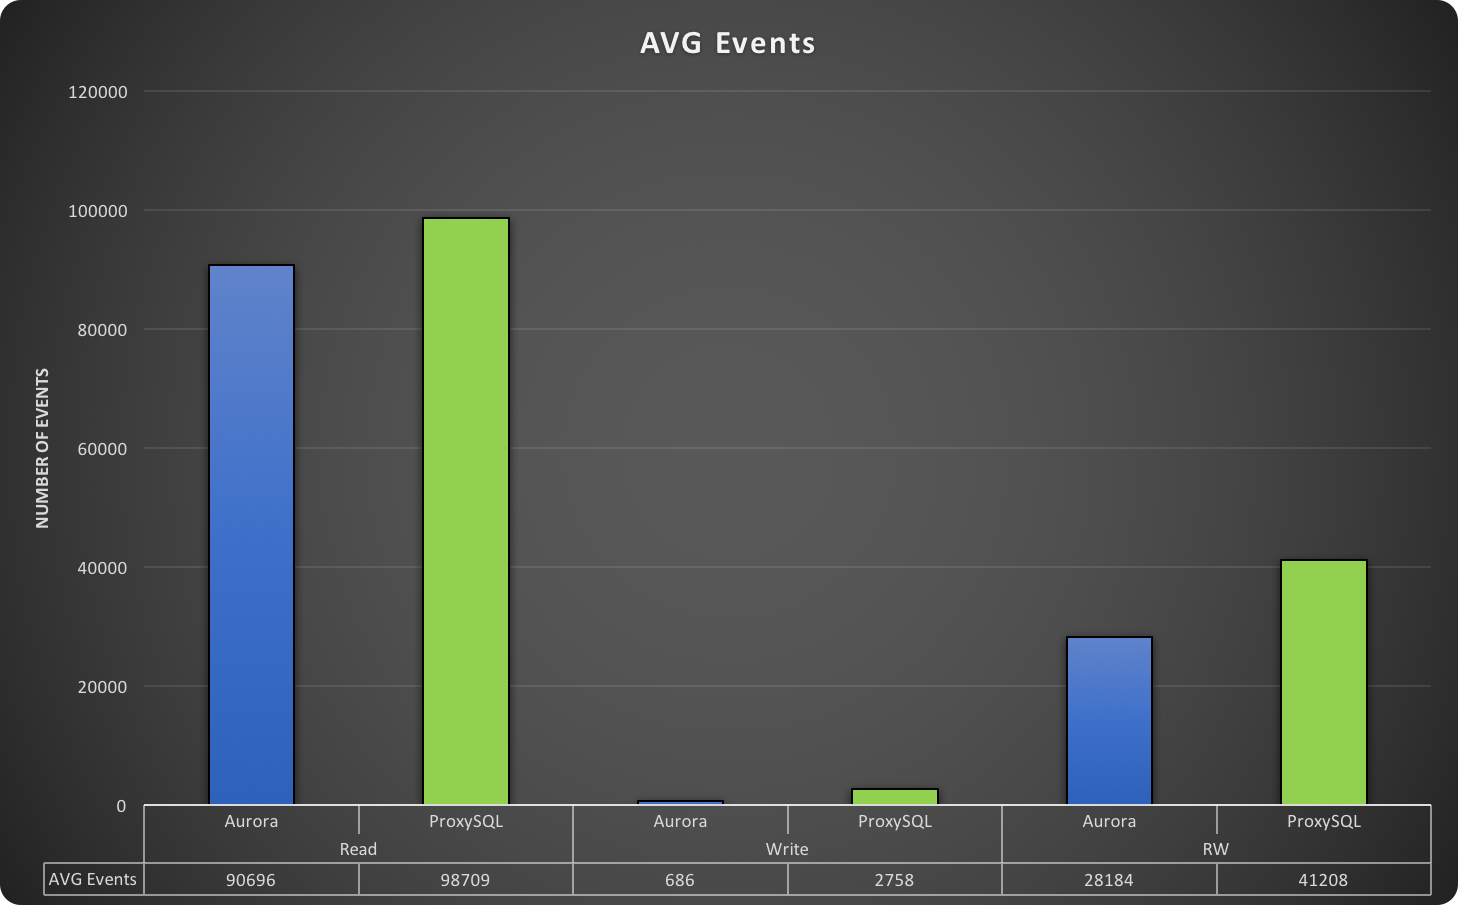
This graph represents the total number of events run at the time of the test. An event is a full application cycle, which sees the application generate the data needed to fill the SQL (no matter if it is for read/write), create the SQL, request the connection, push the SQL, get and read the resultset returned and give back the connection. Once more, ProxySQL shows better performance.
In this graph, lower is better.
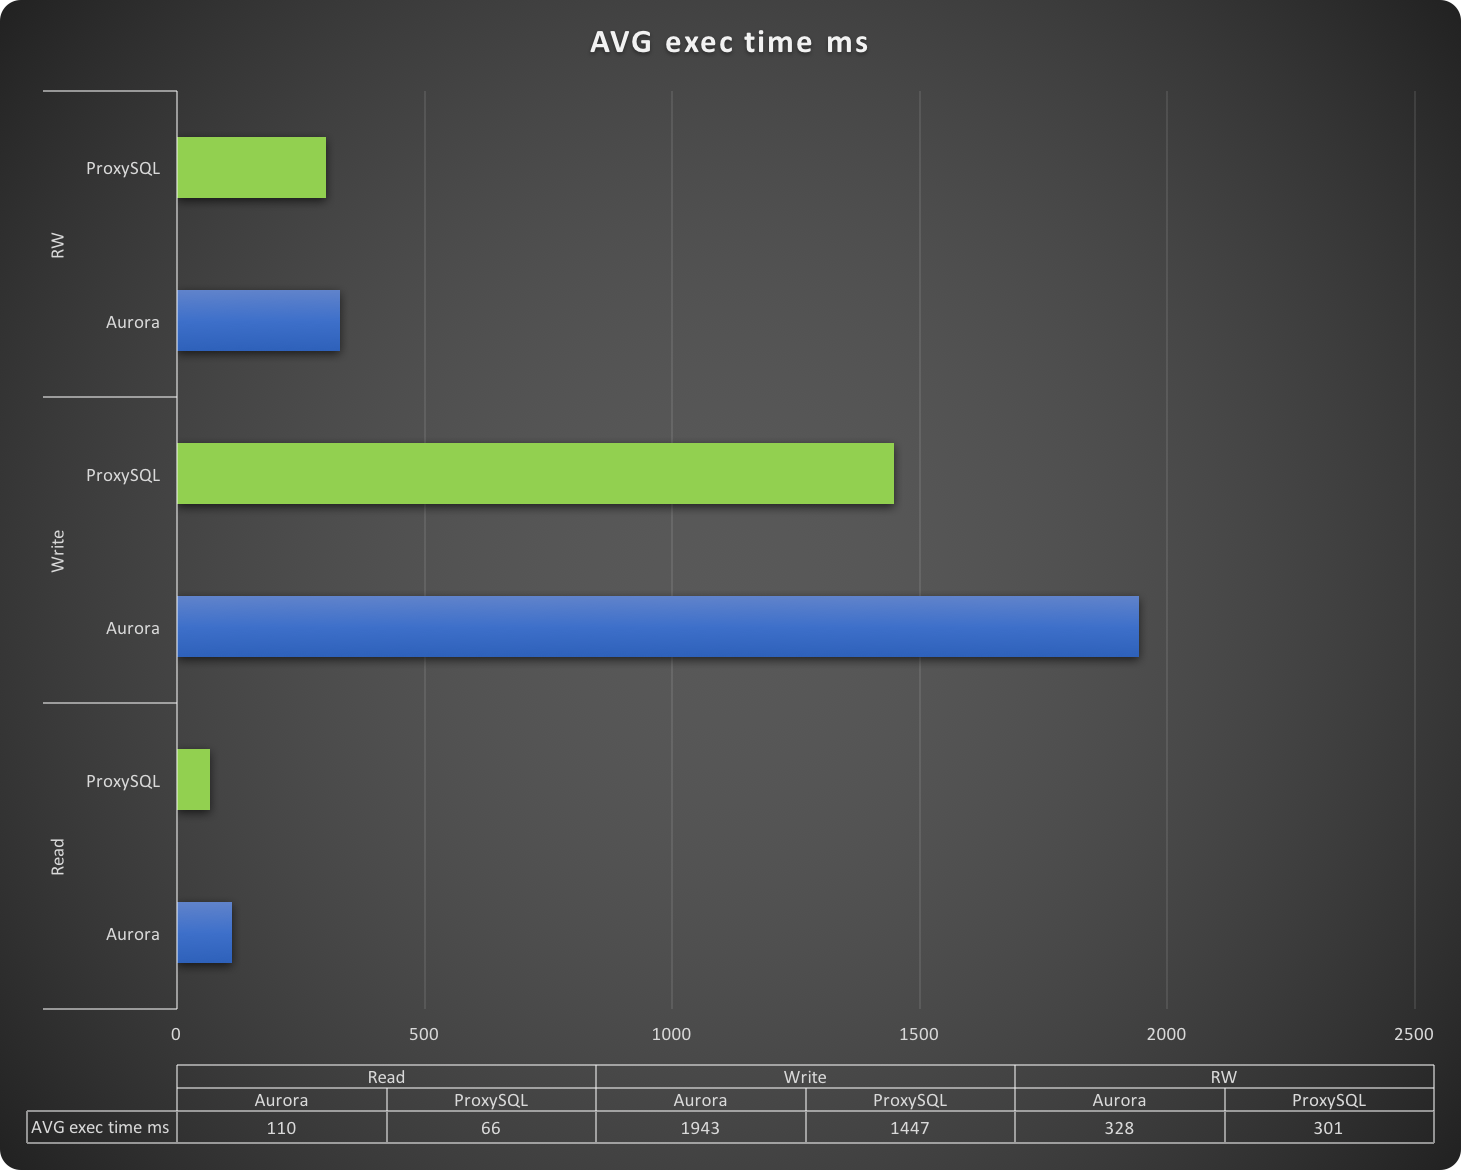
The execution time reported in this graph is the time taken by the application to run a whole event. This is it, execution time is the time of a full cycle. The faster the cycle is executed, the better the application is performing. The time is express in milliseconds and it goes from a very fast read, which probably accesses the cache in Aurora, to almost two seconds taken to insert a batch of rows. Needless to say, the tests using ProxySQL performed better.
But Why?
Why do the tests using ProxySQL perform better? After all, it is just an additional step in the middle, which also has a cost in intercepting the queries and managing the connections.
So why the better performance? The answer is simple and can be found in the Aurora manual: https://docs.aws.amazon.com/AmazonRDS/latest/UserGuide/Aurora.Overview.html#Aurora.Overview.Endpoints.
The Cluster endpoint is an endpoint for an Aurora DB cluster that connects to the current primary instance for that DB cluster. Each Aurora DB cluster has a cluster endpoint and one primary instance.
That endpoint receives the read and write request and sends them to the same instance.The main use for it is to perform failover if needed. At the same time, the Reader endpoint is an endpoint for an Aurora DB cluster that connects to one of the available Aurora Replicas for that DB cluster.
Each Aurora DB cluster has a reader endpoint. If there is more than one Aurora Replica, the reader endpoint directs each connection request to one of the Aurora Replicas. The reader endpoint only load balances connections to available Aurora Replicas in an Aurora DB cluster. It does not load balance specific queries.
If you want to load balance queries to distribute the read workload for a DB cluster, you need to manage that in your application and use instance endpoints to connect directly to Aurora Replicas to balance the load.
This means that to perform a Read/Write split, your application must manage two entry points and you will NOT have much control over how the queries are handled or to which replica instance they are directed.
This could lead to unexpected results and delays. Needless to say, ProxySQL does all that by default (as described in my previous article). Now that we've clarified how Aurora entry points behave, let's see about the performance difference.
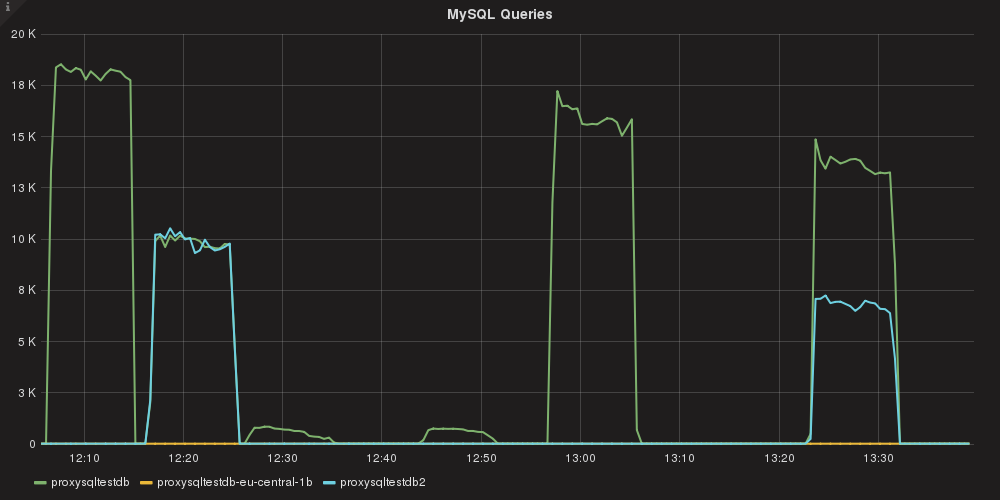
How do we read this graph? From left to right:
- read_only test with an Aurora cluster endpoint
- read_only test with ProxySQL
- write_only with an Aurora cluster endpoint
- write_only with ProxySQL
- read and write with an Aurora cluster endpoint
- read and write with ProxySQL
Here we go! As we can see, the tests with ProxySQL used the two configured instances, splitting R/W without the need to do anything on the application side. I purposely avoided the AZ replica because I previously identified it as having higher latency, so I can exclude it and use it ONLY in the case of an emergency.
The effects are clear in the next graph.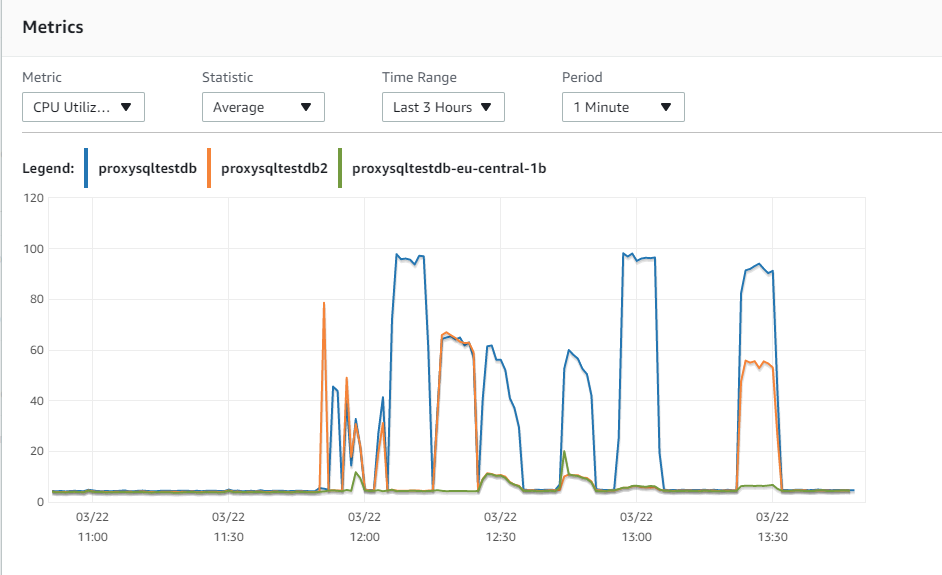
When using the cluster endpoint, given all the load was on a single instance, the CPU utilization is higher and that became a bottleneck. When using ProxySQL, the load is spread across the different instances, allowing real read scalability. This has immediate benefits in read and read/write operations, allowing better load distribution that results in better performance.
Conclusions
Aurora is a very interesting technology and can be a very good solution for read scaling.
But at the moment, the way AWS offers data connectivity with the Cluster endpoints and Reader endpoints can negatively affect performance.
The lack of configuration and the limitation of using different endpoints lead to confusion and less optimized utilization.
The introduction of ProxySQL, which now supports (from version 2) Aurora, allows an architect, SA or DBA to properly configure the environment. You can very granularly choose how to use each instance, without the need to have the application modify how it works. This helps keep the data layer solution separate from the application layer. Even better, this additional set of flexibility does not come with a cost.
On the contrary, it improves resource utilization and brings higher performance using less powerful instances. Given the cost of Aurora, this is not a secondary benefit.
I suggest you try installing ProxySQL v2 (or higher) in front of your Aurora cluster. If you don't feel confident and prefer to have us help you, contact us and we will be more than happy to support you!