Overview
ProxySQL had been adopted as solution for HA in place of HAProxy in Percona PXC package. 
The new solution has a lot of advantages and provide an unbelievable flexibility we did not had before. But when talking about HA and PXC there was still a gap.
As already discussed in my previous article “ProxySQL and Percona XtraDB Cluster (Galera) Integration”(https://www.percona.com/blog/2016/09/15/proxysql-percona-cluster-galera-integration/),
ProxySQL is working great when using multi-master approach, but trying to have it in single Node writer, was not possible unless using creative (nice way to say wrong) solutions like what I was covering in “ProxySQL and PXC using Replication HostGroup” in the same article.
In the following months, I had few emails and requests from colleagues and externals reporting me that some time that specific solution was not working or was not covering this or that case. No matter if I had mark the related feature active_failover as experimental, apparently that in conjunction of Replication HG was deployed as solution.
What was wrong with that? Well first of all that was only a test, an experimental feature, as such I was not going to maintain it or fix bugs. But secondly and more important, it was based on a wrong concept. ProxySQL is on-top-of MySQL as reverse proxy. The specific feature was breaking the main idea and was actually acting on the PXC nodes changing their status (READ_ONLY). That should not happen and any action or operation should involve only the ProxySQL node(s)
Why this blog
This blog will describe what I had implemented in the script as solution (not experimental), for the case in which we need to use PXC in Single Writer Mode (SWM). I will illustrate the new feature in PXC and the additional concept of Failover Host Group (FHG).
After few months, I realized I have to change the script and either remove the experimental feature or redesign it. But something was missed in PXC to allow me (us) to correctly enable the SWM. Actually at the beginning I was looking to have it fully integrated in ProxySQL, and I had several discussion with Percona colleagues, and Rene’, about this. But at the end the PXC new internal features had not be enough to guarantee ProxySQL to be able to identify and manage most dangerous cases. Let us see what had being implemented in PXC and what was still missed such that I had to put my hands on the script code again.
Good .. but not good enough When in the need to have PXC in SWM, we need to have ONE server in the HG receiving the WRITES, and as many as we like in the HG(s) receiving the READS.
What this imply is that ProxySQL either need to perform this operation using Replication HG (abusing of the READ_ONY flag), or we need a way to:
- Identify which node(s) can be a WRITER candidate in place of
- Identify/assign the correct relevance and priority to each candidate
- Have a unique view to recognize the nodes in the cluster and their segment membership Identify as much as possible any reason(s) for which a node cannot be used as writer
What we were discussing internally, was to have a solution that would allow us to see the cluster status no matter which node would answer us, and should also be able to provide us which node could become the next writer. This last should be eventually evaluated against custom settings/preferences.
PXC 5.7.19 come with a new feature pxc_cluster_view, a table that reside in performance_schema and that can be easily access simply doing :
(pxc_test@192.168.1.11) [(none)]>select * FROM performance_schema.pxc_cluster_view ORDER BY SEGMENT,LOCAL_INDEX;
+-----------+--------------------------------------+--------+-------------+---------+
| HOST_NAME | UUID | STATUS | LOCAL_INDEX | SEGMENT |
+-----------+--------------------------------------+--------+-------------+---------+
| node1 | 05b5554f-be34-11e7-aa92-5e038abbae35 | SYNCED | 0 | 1 |
| node2 | 63870cc3-af5d-11e7-a0db-463be8426737 | SYNCED | 1 | 1 |
| node3 | 666ad5a0-af5d-11e7-9b39-2726e5de8eb1 | SYNCED | 2 | 1 |
| node6 | 7540bdca-b267-11e7-bae9-464c3d263470 | SYNCED | 3 | 2 |
| node5 | ab551483-b267-11e7-a1a1-9be1826f877f | SYNCED | 4 | 2 |
| node4 | e24ebd01-af5d-11e7-86f0-42c8ceb6886c | SYNCED | 5 | 2 |
+-----------+--------------------------------------+--------+-------------+---------+
As you can see the table is reporting us the list of ALL nodes ordered by Segment and LOCAL_INDEX. Why I had use that sort? Because this order will give me, in descending order, the priority for which PXC see the nodes. As we know segment is assigned and is part of the customization/design we have to take care when deploying the cluster. Local_Index, instead, is an auto calculated value against the UUID assigned internally by the cluster. As such while this is a good indicator internally, is totally useless for us in case we want to “customize” the priority.
But this is not all, as already covered in my previously mentioned article, PXC/Galera nodes can be in a state that will prevent the proper access to them, without having ProxySQL realizing it … or PXC itself .
One very simple example is the following:
(root@localhost) [(none)]>set global wsrep_reject_queries=ALL;
2017-11-06T19:21:14.533407Z 738828 [Note] WSREP: Rejecting client queries due to manual setting
(pxc_test@192.168.1.231) [(none)]>select now();select * FROM performance_schema.pxc_cluster_view ORDER BY SEGMENT,LOCAL_INDEX;
| 2017-11-06 14:22:19 |
| HOST_NAME | UUID | STATUS | LOCAL_INDEX | SEGMENT |
| node1 | 05b5554f-be34-11e7-aa92-5e038abbae35 | SYNCED | 0 | 1 | ← still looks good
| node2 | 63870cc3-af5d-11e7-a0db-463be8426737 | SYNCED | 1 | 1 |
| node3 | 666ad5a0-af5d-11e7-9b39-2726e5de8eb1 | SYNCED | 2 | 1 |
| node6 | 7540bdca-b267-11e7-bae9-464c3d263470 | SYNCED | 3 | 2 |
| node5 | ab551483-b267-11e7-a1a1-9be1826f877f | SYNCED | 4 | 2 |
| node4 | e24ebd01-af5d-11e7-86f0-42c8ceb6886c | SYNCED | 5 | 2 |
No need to say that by default the Vanilla ProxySQL version will not catch that either, so Bingo! Or to be more correct BOOOM!
Your cluster is doomed, because by mistake or on purpose something not traced had stop your production Write node.
So what else/more do we need, to have not only an healty PXC cluster but also the chance to perform a nice failover when using SWM?
- Well of course the script covering the different node state, and that my script was already doing it.
- We need to have the chance to indicate a list of preferred node, with priority. After we can decide to go for the priority as it comes from pxc_cluster_view if for any reasons our choice will not work. Or even go for a different segment as last resource but still respecting the pxc_cluster_view.
To fix the first and second points, I had first look to what had been done in ProxySQL for group replication. Group Replication has a dedicated table with a lot of additional information:
- writer_hostgroup
- backup_writer_hostgroup
- reader_hostgroup
- offline_hostgroup
- active
- max_writers
- writer_is_also_reader
- Max_transactions_behind
This could make sense for Group replication, also if I consider it a bit redundant, but for us and PXC, that would be too much and no needed given I can resolve to have what I need in a more elegant way.
Keep in mind that when Rene’ had implement the HostGroup approach he had put the foundations of an unbelievable flexibility with elegance and consistency.
Everything in ProxySQL revolve around HG, we do not have servers (well we do as part of) we have HG, our rules point to HG, queries are directed to HG servers are incidentally mention as part of HG.
So why not take the benefit of this? Afterall I had already used the special group 9000 to manage edge cases of maintenance and offline.
The only problem was, do I have all the information I need there? Let us see the content of mysql_servers table:
- hostgroup_id
- hostname
- port
- status
- weight
- compression
- max_connections
- max_replication_lag
- use_ssl
- max_latency_ms
- comment
To generate a list of candidates WRITER for PXC, I need exactly that nothing less or more.
The new mysql_servers table will looks like:
1
2
3
4
5
6
7
8
9
10
11
12
13
14
15
16
|
SELECT hostgroup_id,hostname,port,STATUS,weight FROM runtime_mysql_servers ORDER BY hostgroup_id,weight DESC;
+--------------+---------------+------+--------+---------+
| hostgroup_id | hostname      | port | STATUS | weight  |
+--------------+---------------+------+--------+---------+
| 50           | 192.168.1.205 | 3306 | ONLINE | 1000000 |<-- writer
| 52           | 192.168.1.21  | 3306 | ONLINE | 1000000 |
| 52           | 192.168.1.233 | 3306 | ONLINE | 10      |
| 52           | 192.168.1.205 | 3306 | ONLINE | 1       |
| 52           | 192.168.1.22  | 3306 | ONLINE | 1       |
| 52           | 192.168.1.23  | 3306 | ONLINE | 1       |
| 52           | 192.168.1.231 | 3306 | ONLINE | 1       |
| 8050         | 192.168.1.205 | 3306 | ONLINE | 1000000 |<-- Candidates with weight
| 8050         | 192.168.1.231 | 3306 | ONLINE | 10000   |<--
| 8050         | 192.168.1.22  | 3306 | ONLINE | 100000  |<--
+--------------+---------------+------+--------+---------+
|
Now that we had established we have what we need, let us test, the solution.

Implement and test SWM and HA with galera_check.pl
As previously discuss the new script can efficiently manage the SWM and HA, using 3 different methods of failover:
- Use special HG8000 to set preferences
- Use pxc_cluster_view inside same segment
- Last resource pxc_cluster_view in ANY segment
What we will test is:
- Controlled failover for maintenance
- Server cannot get queries
- Server crash
Failover methods:
- Use provided list of servers
- Use pxc_cluster_view for same segment
- Use pxc_cluster_view for all segment
We will have:
- 6 nodes
- 2 segments
- 2 HG (with read/write split)
We will test it as we did for https://www.percona.com/blog/2016/09/15/proxysql-percona-cluster-galera-integration/ with Sysbench commands:
Prepare
sysbench --test=/usr/share/doc/sysbench/tests/db/oltp.lua --mysql-host=192.168.1.11 --mysql-port=6033 --mysql-user=pxc_test --mysql-password=test --mysql-db=test_galera --db-driver=mysql --oltp-tables-count=50 --oltp-tablesize=50000 --num-threads=10 --report-interval=10  prepare

Write
sysbench --test=/usr/share/doc/sysbench/tests/db/oltp.lua --mysql-host=192.168.1.11 --mysql-port=6033 --mysql-user=pxc_test --mysql-password=test --mysql-db=test_galera --db-driver=mysql --oltp-tables-count=50 --oltp-tablesize=50000 --max-requests=0 --max-time=9000 --oltp-point-selects=5 --oltp-read-only=off --oltp-dist-type=uniform --oltp-reconnect-mode=transaction --oltp-skip-trx=off --num-threads=10 --report-interval=10 --mysql-ignore-errors=all run

Read only
sysbench --test=/usr/share/doc/sysbench/tests/db/oltp.lua --mysql-host=192.168.1.11 --mysql-port=6033 --mysql-user=pxc_test --mysql-password=test --mysql-db=test_galera --db-driver=mysql --oltp-tables-count=50 --oltp-tablesize=50000 --max-requests=0 --max-time=9000 --oltp-point-selects=5 --oltp-read-only=on --num-threads=10 --oltp-reconnect-mode=query --oltp-skip-trx=on --report-interval=10 --mysql-ignore-errors=all run
Set it up:
UPDATE global_variables SET Variable_Value=0 WHERE Variable_name='mysql-hostgroup_manager_verbose';
Please take a moment to note the above setting.
IF you omit ProxySQL will verbosely report host-groups changes, I suggest to put it to 0 unless you are trying to debug “something” or your logs will become enormous soon.
INSERT INTO mysql_users (username,password,active,default_hostgroup,default_schema,transaction_persistent) VALUES ('pxc_test','test',1,50,'mysql',1);
LOAD MYSQL USERS TO RUNTIME;SAVE MYSQL USERS TO DISK;
Below the entries to populate add your servers:
DELETE FROM mysql_servers WHERE hostgroup_id IN (50,52);

INSERT INTO mysql_servers (hostname,hostgroup_id,port,weight,max_connections) VALUES ('192.168.1.21',50,3306,1000000,2000);

INSERT INTO mysql_servers (hostname,hostgroup_id,port,weight,max_connections) VALUES ('192.168.1.205',52,3306,1,2000);
INSERT INTO mysql_servers (hostname,hostgroup_id,port,weight,max_connections) VALUES ('192.168.1.21',52,3306,1000000,2000);
INSERT INTO mysql_servers (hostname,hostgroup_id,port,weight,max_connections) VALUES ('192.168.1.231',52,3306,1,2000);

INSERT INTO mysql_servers (hostname,hostgroup_id,port,weight,max_connections) VALUES ('192.168.1.22',52,3306,1,2000);
INSERT INTO mysql_servers (hostname,hostgroup_id,port,weight,max_connections) VALUES ('192.168.1.23',52,3306,1,2000);
INSERT INTO mysql_servers (hostname,hostgroup_id,port,weight,max_connections) VALUES ('192.168.1.233',52,3306,10,2000);
Here the section with the list of WRITER candidates:
INSERT INTO mysql_servers (hostname,hostgroup_id,port,weight,max_connections) VALUES ('192.168.1.205',8050,3306,1000000,2000);
INSERT INTO mysql_servers (hostname,hostgroup_id,port,weight,max_connections) VALUES ('192.168.1.231',8050,3306,100000,2000);
INSERT INTO mysql_servers (hostname,hostgroup_id,port,weight,max_connections) VALUES ('192.168.1.22',8050,3306,100000,2000);

LOAD MYSQL SERVERS TO RUNTIME; SAVE MYSQL SERVERS TO DISK;
Finally query rules to have read/write split:
DELETE FROM mysql_query_rules WHERE rule_id IN (40,41,45,46,80,81);
INSERT INTO mysql_query_rules (rule_id,proxy_port,username,destination_hostgroup,active,retries,match_digest,apply) VALUES(4,6033,'pxc_test',50,1,3,'.',1);
INSERT INTO mysql_query_rules (rule_id,proxy_port,username,destination_hostgroup,active,retries,match_digest,apply) VALUES(40,6033,'pxc_test',50,1,3,'^SELECT.*FOR UPDATE',1);
INSERT INTO mysql_query_rules (rule_id,proxy_port,username,destination_hostgroup,active,retries,match_digest,apply) VALUES(41,6033,'pxc_test',52,1,3,'^SELECT ',1);

LOAD MYSQL QUERY RULES TO RUNTIME;SAVE MYSQL QUERY RULES TO DISK;
Time to test our SWM and failover.
Clone the script from git in your preferred directory, I will put it in opt for now.
git clone https://github.com/Tusamarco/proxy_sql_tools
chmod +x  /opt/proxy_sql_tools/galera_check.pl
Add to the script to the scheduler
DELETE FROM scheduler WHERE id=10;
INSERT  INTO scheduler (id,active,interval_ms,filename,arg1) VALUES (10,0,2000,"/opt/proxy_sql_tools/galera_check.pl","-u=admin -p=admin -h=127.0.0.1 -H=50:W,52:R -P=6032 --execution_time=0 --retry_down=0 --retry_up=0 --main_segment=1 --debug=0  --log=/var/lib/proxysql/galeraLog --active_failover=1");
LOAD SCHEDULER TO RUNTIME;SAVE SCHEDULER TO DISK;
Make it active:
UPDATE scheduler SET active=1 WHERE id=10; LOAD scheduler TO run;
If you had left the --execution_time=1 the script will constantly print the time it takes to execute in the log:
2017/11/10 09:03:44.439:[INFO] END EXECUTION Total Time(ms):391
I suggest you to initially keep it on so you will see what is actually happening.
Time to perform the first test.
Controlled failover for maintenance
 When you want to do a CONTROLLED failover, the best way to do with minimal impact is to manually add the second node with very low weight, and after remove the node you need to work on. I will show you how to do this safely.
Add the new new write node to the writer HG:
INSERT INTO mysql_servers (hostname,hostgroup_id,port,weight,max_connections) VALUES ('192.168.1.205',50,3306,1,2000);
LOAD mysql servers TO run;
You will have something like this:
+---------+-----------+---------------+----------+--------+----------+----------+--------+---------+---------+-----------------+-----------------+------------+
| weight  | hostgroup | srv_host      | srv_port | STATUS | ConnUsed | ConnFree | ConnOK | ConnERR | Queries | Bytes_data_sent | Bytes_data_recv | Latency_us |
+---------+-----------+---------------+----------+--------+----------+----------+--------+---------+---------+-----------------+-----------------+------------+
| 1000000 | 50        | 192.168.1.21  | 3306     | ONLINE | 10       | 0        | 35863  | 0       | 1137903 | 75147779        | 1527773047     | 6794       |
| 1       | 50        | 192.168.1.205 | 3306     | ONLINE | 0        | 0        | 0      | 0       | 0       | 0               | 0              | 8236       |
| 1000    | 52        | 192.168.1.233 | 3306     | ONLINE | 8        | 1        | 33153  | 0       | 1747722 | 82574272        | 3919114554     | 9304       |
| 1000    | 52        | 192.168.1.231 | 3306     | ONLINE | 3        | 6        | 15206  | 0       | 1469312 | 69597188        | 3340444198     | 2989       |
| 1000    | 52        | 192.168.1.23  | 3306     | ONLINE | 6        | 3        | 36690  | 4       | 2046599 | 96797464        | 4606494587     | 10261      |
| 1000    | 52        | 192.168.1.22  | 3306     | ONLINE | 4        | 5        | 36778  | 262     | 2152217 | 101807337       | 4846638759      | 2108       |
| 10      | 52        | 192.168.1.21  | 3306     | ONLINE | 0        | 1        | 302    | 0       | 21960   | 1039596         | 49257671       | 6794       |
| 1000    | 52        | 192.168.1.205 | 3306     | ONLINE | 3        | 6        | 31355  | 0       | 2180310 | 103198644       | 4917528180      | 8236       |
+---------+-----------+---------------+----------+--------+----------+----------+--------+---------+---------+-----------------+-----------------+------------+
With the added host handling very few connections because the weight.
At this point you just need to connect to the node you want to put in maintenance and set it desync:
SET global wsrep_desync=1;
Once desync the script will put the server in OFFLINE_SOFT for you, and the server will allow the running connection to complete while the new ones will go to the node we had just insert.
No errors no service interruption at all:
2017/11/10 09:31:41.967:[WARN]  Move node:192.168.1.21;3306;50;3010 SQL: UPDATE mysql_servers SET status='OFFLINE_SOFT' WHERE hostgroup_id=50 AND hostname='192.168.1.21' AND port='3306'
2017/11/10 09:31:41.978:[WARN]  Move node:192.168.1.21;3306;52;3010 SQL: UPDATE mysql_servers SET status='OFFLINE_SOFT' WHERE hostgroup_id=52 AND hostname='192.168.1.21' AND port='3306'
Once maintenance is done, just reverse the wsrep_desync and the script will put the node back to the pool.
If you need to stop the mysql server on that node and you do not want it automatically back, remember to remove the entry from the host group 50 (the Writer one) or it will be automatically placed back in production as active.
DELETE FROM mysql_servers WHERE hostname=”192.168.1.21” AND port=3306 AND hostgroup_id=50;
LOAD mysql servers TO run;
Remember at the and to remove the temporary node from the Writer HG.
Real failover
Now a real fail over and we will test it using wsrep_rejectqueries to trigger the issue, but that can be any other issue.
In this test, given there is no other node accepting the writes in the HG, we should expect some connections error, but what we want is to have the failover in very short time.
Keep in mind we have define these as possible failover candidates:
+--------------+---------------+------+--------+---------+
| hostgroup_id | hostname      | port | STATUS | weight  |
+--------------+---------------+------+--------+---------+
| 8050         | 192.168.1.205 | 3306 | ONLINE | 1000000 |
| 8050         | 192.168.1.22  | 3306 | ONLINE | 100000  |
| 8050         | 192.168.1.231 | 3306 | ONLINE | 100000  |
+--------------+---------------+------+--------+---------+

While the pxc_cluster_view sees the following:

+-----------+--------------------------------------+--------+-------------+---------+
| HOST_NAME | UUID                                 | STATUS | LOCAL_INDEX | SEGMENT |
+-----------+--------------------------------------+--------+-------------+---------+
| node1     | 05b5554f-be34-11e7-aa92-5e038abbae35 | SYNCED |           0 |       1 |
| node2     | 63870cc3-af5d-11e7-a0db-463be8426737 | SYNCED |           2 |       1 |
| node3     | 666ad5a0-af5d-11e7-9b39-2726e5de8eb1 | SYNCED |           3 |       1 |
| node5     | 07f55a00-c57a-11e7-bd7d-8a568ca96345 | SYNCED |           1 |       2 |
| node4     | 6c185b87-c57a-11e7-b2a6-8f095c523cd3 | SYNCED |           4 |       2 |
| node6     | 7540bdca-b267-11e7-bae9-464c3d263470 | SYNCED |           5 |       2 |
+-----------+--------------------------------------+--------+-------------+---------+

FOR better understanding also FOR the following tests this IS the mapping, node name <> IP:
+-----------+---------------+
| HOST_NAME | IP            |
+-----------+---------------+
| node1     | 192.168.1.205 |
| node2     | 192.168.1.21  |
| node3     | 192.168.1.231 |
| node5     | 192.168.1.23  |
| node4     | 192.168.1.22  |
| node6     | 192.168.1.233 |
+-----------+---------------+
My Servers layout is:
+--------------+---------------+------+--------+---------+
| hostgroup_id | hostname      | port | STATUS | weight  |
+--------------+---------------+------+--------+---------+
| 50           | 192.168.1.205 | 3306 | ONLINE | 1000000 | ← writer
| 52           | 192.168.1.205 | 3306 | ONLINE | 1000    |
| 52           | 192.168.1.22  | 3306 | ONLINE | 1000    |
| 52           | 192.168.1.23  | 3306 | ONLINE | 1000    |
| 52           | 192.168.1.231 | 3306 | ONLINE | 1000    |
| 52           | 192.168.1.233 | 3306 | ONLINE | 1000    |
| 52           | 192.168.1.21  | 3306 | ONLINE | 10      |
| 8050         | 192.168.1.205 | 3306 | ONLINE | 1000000 |
| 8050         | 192.168.1.22  | 3306 | ONLINE | 100000  |
| 8050         | 192.168.1.231 | 3306 | ONLINE | 100000  |
+--------------+---------------+------+--------+---------+
The first candidate is
192.168.1.22
which is node4 and stay in a DIFFERENT segment than the current writer. As such the first election should go to the other node
192.168.1.231
which is Node3 and reside in the same segment.
Let us see what happens with the active-failover=1:
Do:
set global wsrep_reject_queries=all;
On the current writer.
The script will identify the Writer cannot accept queries and will take action:
2017/11/13 10:51:52.856:[WARN]  Move node:192.168.1.205;3306;50;3001 SQL: UPDATE mysql_servers SET hostgroup_id=9050 WHERE hostgroup_id=50 AND hostname='192.168.1.205' AND port='3306'
2017/11/13 10:51:52.861:[WARN]  Move node:192.168.1.205;3306;52;3001 SQL: UPDATE mysql_servers SET hostgroup_id=9052 WHERE hostgroup_id=52 AND hostname='192.168.1.205' AND port='3306'
2017/11/13 10:51:55.038:[WARN] Fail-over in action Using Method = 1
2017/11/13 10:51:55.038:[INFO] Special Backup - Group found! I am electing a node to writer following the indications
 This Node Try to become the new WRITER for HG 50 Server details: 192.168.1.231:3306:HG8050
2017/11/13 10:51:55.038:[INFO] This Node Try to become a WRITER promoting to HG 50192.168.1.231:3306:HG8050
2017/11/13 10:51:55.083:[WARN]  Move node:192.168.1.231:33061000002000 SQL:INSERT INTO mysql_servers (hostname,hostgroup_id,port,weight,max_connections) VALUES ('192.168.1.231',50,3306,100000,2000);
It will also analyze the failover candidates and it will promote one node if present. Also as expected it will choose the one in the same segment.
What happen at the applications?
Writes
[ 2010s ] thds: 10 tps: 33.40 qps: 503.33 (r/w/o: 302.92/127.31/73.10) lat (ms,95%): 434.83 err/s: 0.00 reconn/s: 0.00
[ 2020s ] thds: 10 tps: 38.30 qps: 575.27 (r/w/o: 344.68/147.59/82.99) lat (ms,95%): 376.49 err/s: 0.00 reconn/s: 0.00
[ 2030s ] thds: 10 tps: 35.80 qps: 537.20 (r/w/o: 322.40/137.90/76.90) lat (ms,95%): 419.45 err/s: 0.00 reconn/s: 0.00
[ 2040s ] thds: 10 tps: 32.70 qps: 489.34 (r/w/o: 293.53/125.71/70.11) lat (ms,95%): 427.07 err/s: 0.00 reconn/s: 0.00
[ 2050s ] thds: 10 tps: 30.60 qps: 456.43 (r/w/o: 273.62/117.61/65.20) lat (ms,95%): 493.24 err/s: 0.00 reconn/s: 0.00
[ 2060s ] thds: 10 tps: 19.20 qps: 298.36 (r/w/o: 181.18/74.99/42.19) lat (ms,95%): 657.93 err/s: 0.00 reconn/s: 30.50 <-- here
[ 2070s ] thds: 10 tps: 23.40 qps: 345.80 (r/w/o: 206.30/89.10/50.40) lat (ms,95%): 634.66 err/s: 0.00 reconn/s: 0.00
[ 2080s ] thds: 10 tps: 27.20 qps: 414.93 (r/w/o: 249.72/106.71/58.50) lat (ms,95%): 612.21 err/s: 0.00 reconn/s: 0.00

Reads
[ 2000s ] thds: 30 tps: 256.50 qps: 2309.91 (r/w/o: 2309.91/0.00/0.00) lat (ms,95%): 189.93 err/s: 0.00 reconn/s: 0.00
[ 2010s ] thds: 30 tps: 250.27 qps: 2254.26 (r/w/o: 2254.26/0.00/0.00) lat (ms,95%): 200.47 err/s: 0.00 reconn/s: 0.00
[ 2020s ] thds: 30 tps: 256.29 qps: 2305.30 (r/w/o: 2305.30/0.00/0.00) lat (ms,95%): 186.54 err/s: 0.00 reconn/s: 0.00
[ 2030s ] thds: 30 tps: 241.65 qps: 2176.28 (r/w/o: 2176.28/0.00/0.00) lat (ms,95%): 193.38 err/s: 0.00 reconn/s: 0.00
[ 2040s ] thds: 30 tps: 217.88 qps: 1956.96 (r/w/o: 1956.96/0.00/0.00) lat (ms,95%): 215.44 err/s: 0.00 reconn/s: 0.00
[ 2050s ] thds: 30 tps: 277.70 qps: 2504.09 (r/w/o: 2504.09/0.00/0.00) lat (ms,95%): 196.89 err/s: 0.00 reconn/s: 0.00
[ 2060s ] thds: 30 tps: 207.37 qps: 1863.52 (r/w/o: 1863.52/0.00/0.00) lat (ms,95%): 240.02 err/s: 0.00 reconn/s: 0.00
[ 2070s ] thds: 30 tps: 199.44 qps: 1795.70 (r/w/o: 1795.70/0.00/0.00) lat (ms,95%): 244.38 err/s: 0.00 reconn/s: 0.00
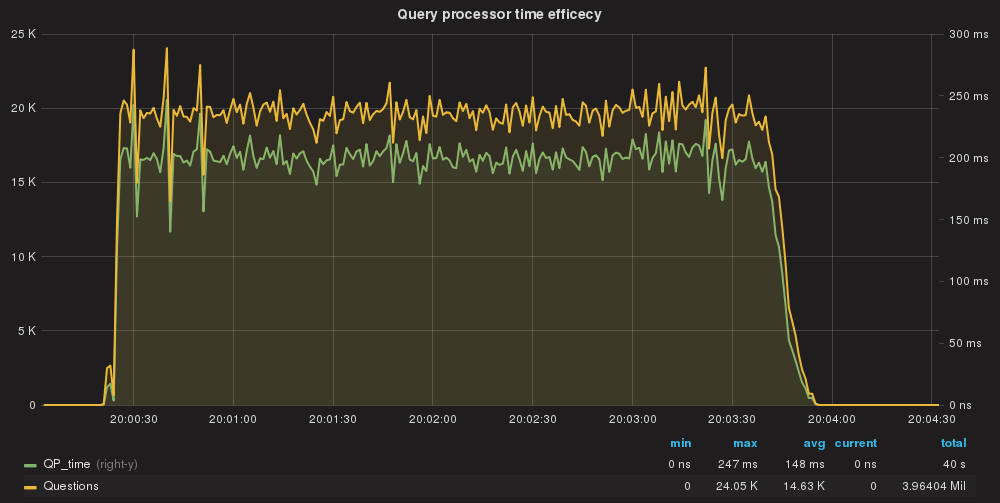
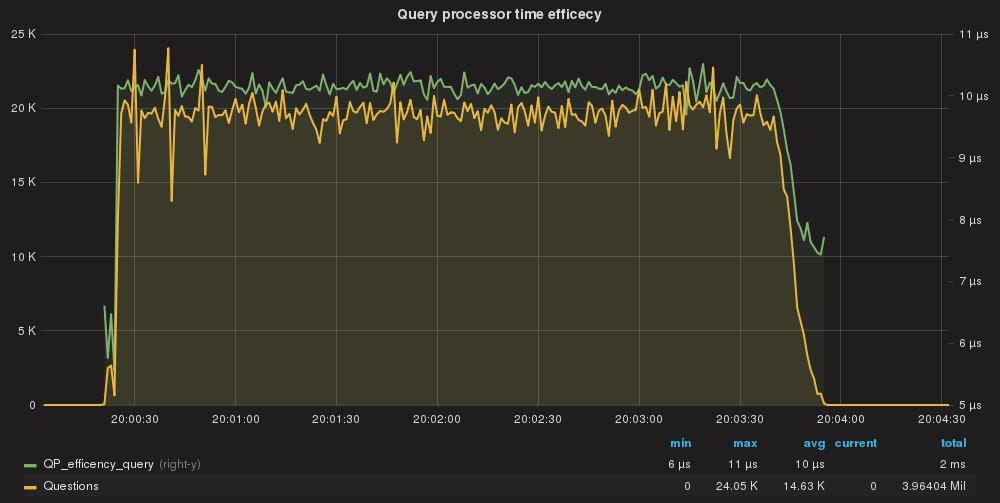
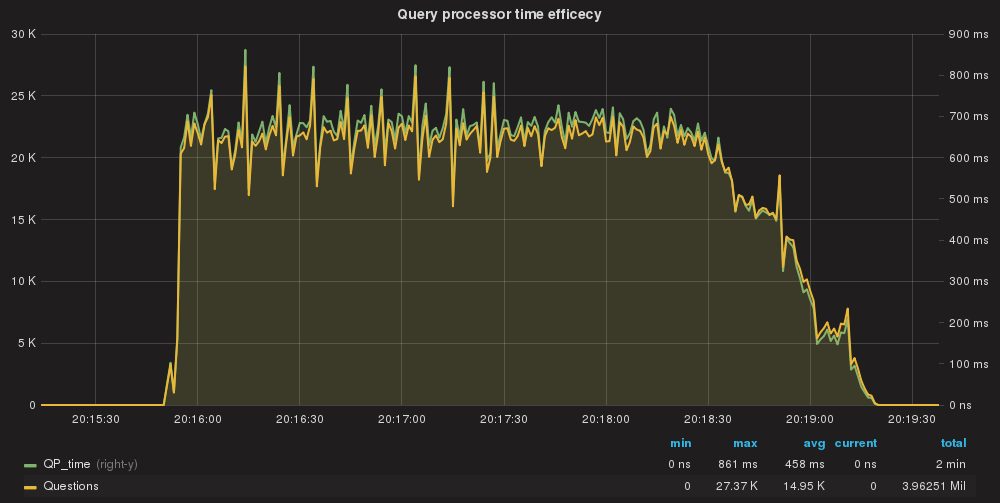
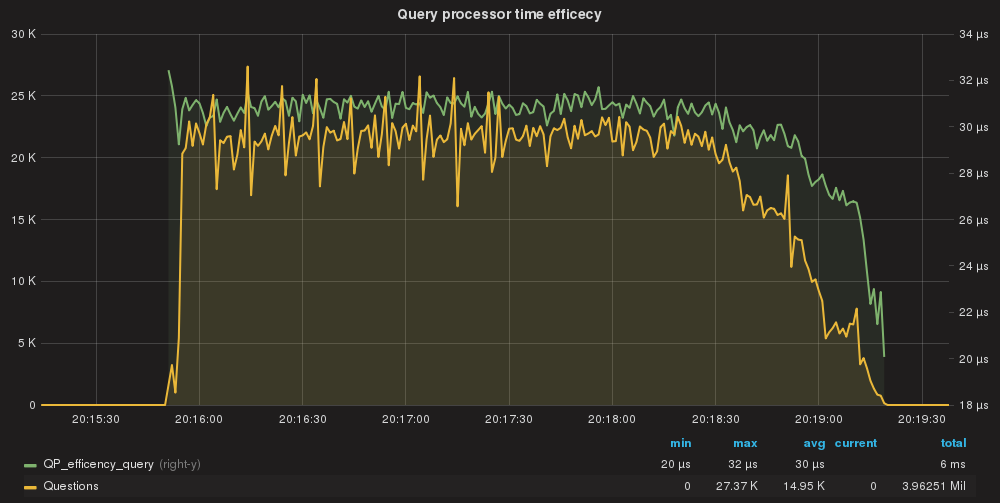
The moment of the server lock the application had a hiccup for the write as expected, but the time was very limited and the difference in WRITE transactions was only of 75-89/sec against the normally processed ~120/sec, as such only ~50 missed during the incident.Reads 0 loss.
What if there is no other server in same segment?
My new servers layout is:
+--------------+---------------+------+--------+---------+
| hostgroup_id | hostname      | port | STATUS | weight  |
+--------------+---------------+------+--------+---------+
| 50           | 192.168.1.231 | 3306 | ONLINE | 100000  | <--- new
| 52           | 192.168.1.22  | 3306 | ONLINE | 1000    |
| 52           | 192.168.1.23  | 3306 | ONLINE | 1000    |
| 52           | 192.168.1.231 | 3306 | ONLINE | 1000    |
| 52           | 192.168.1.233 | 3306 | ONLINE | 1000    |
| 52           | 192.168.1.21  | 3306 | ONLINE | 10      |
| 8050         | 192.168.1.205 | 3306 | ONLINE | 1000000 |
| 8050         | 192.168.1.22  | 3306 | ONLINE | 100000  |
| 8050         | 192.168.1.231 | 3306 | ONLINE | 100000  |
| 9052         | 192.168.1.205 | 3306 | ONLINE | 1000    | <--- set in special group
+--------------+---------------+------+--------+---------+
Let us put down the writer again.
At this point the only available node is the one on the other segment.
As expected the script will identify the failed node and will take action:
2017/11/13 12:15:18.535:[WARN]  Move node:192.168.1.231;3306;50;3001 SQL: UPDATE mysql_servers SET hostgroup_id=9050 WHERE hostgroup_id=50 AND hostname='192.168.1.231' AND port='3306'
2017/11/13 12:15:18.543:[WARN]  Move node:192.168.1.231;3306;52;3001 SQL: UPDATE mysql_servers SET hostgroup_id=9052 WHERE hostgroup_id=52 AND hostname='192.168.1.231' AND port='3306'
2017/11/13 12:15:20.646:[WARN] Fail-over in action Using Method = 1
2017/11/13 12:15:20.646:[INFO] Special Backup - Group found! I am electing a node to writer following the indications
 This Node Try to become the new WRITER for HG 50 Server details: 192.168.1.22:3306:HG8050
2017/11/13 12:15:20.646:[INFO] This Node Try to become a WRITER promoting to HG 50192.168.1.22:3306:HG8050
2017/11/13 12:15:20.660:[WARN]  Move node:192.168.1.22:33061000002000 SQL:INSERT INTO mysql_servers (hostname,hostgroup_id,port,weight,max_connections) VALUES ('192.168.1.22',50,3306,100000,2000);
This because when using automatic_failover=1 I assume YOU KNOW what you are doing in using a failover group. As such while I still use the segments for internal priority, I am not filtering out the node(s) in a different segment, as if using automatic_failover=2.
Same minimal impact on TPS:
Writes
[ 7040s ] thds: 10 tps: 26.39 qps: 395.02 (r/w/o: 236.85/101.48/56.69) lat (ms,95%): 569.67 err/s: 0.00 reconn/s: 0.00
[ 7050s ] thds: 10 tps: 26.81 qps: 405.20 (r/w/o: 243.16/104.73/57.31) lat (ms,95%): 623.33 err/s: 0.00 reconn/s: 0.00
[ 7060s ] thds: 10 tps: 18.80 qps: 276.65 (r/w/o: 167.27/68.29/41.09) lat (ms,95%): 634.66 err/s: 0.00 reconn/s: 23.70
[ 7070s ] thds: 10 tps: 18.90 qps: 292.87 (r/w/o: 177.78/73.99/41.10) lat (ms,95%): 5813.24 err/s: 0.00 reconn/s: 2.80
[ 7080s ] thds: 10 tps: 24.00 qps: 356.84 (r/w/o: 213.42/91.71/51.71) lat (ms,95%): 623.33 err/s: 0.00 reconn/s: 0.00
[ 7090s ] thds: 10 tps: 20.60 qps: 312.27 (r/w/o: 187.58/79.69/45.00) lat (ms,95%): 759.88 err/s: 0.00 reconn/s: 0.00
[ 7100s ] thds: 10 tps: 19.80 qps: 299.33 (r/w/o: 179.02/78.41/41.90) lat (ms,95%): 787.74 err/s: 0.00 reconn/s: 0.00
[ 7110s ] thds: 10 tps: 26.70 qps: 398.33 (r/w/o: 239.12/101.51/57.70) lat (ms,95%): 669.89 err/s: 0.00 reconn/s: 0.00</pre>

Reads
[ 7040s ] thds: 30 tps: 207.90 qps: 1870.43 (r/w/o: 1870.43/0.00/0.00) lat (ms,95%): 227.40 err/s: 0.00 reconn/s: 0.00
[ 7050s ] thds: 30 tps: 198.88 qps: 1790.44 (r/w/o: 1790.44/0.00/0.00) lat (ms,95%): 240.02 err/s: 0.00 reconn/s: 0.00
[ 7060s ] thds: 30 tps: 165.52 qps: 1488.05 (r/w/o: 1488.05/0.00/0.00) lat (ms,95%): 282.25 err/s: 0.00 reconn/s: 0.00
[ 7070s ] thds: 30 tps: 186.87 qps: 1681.46 (r/w/o: 1681.46/0.00/0.00) lat (ms,95%): 267.41 err/s: 0.00 reconn/s: 0.00
[ 7080s ] thds: 30 tps: 178.24 qps: 1607.05 (r/w/o: 1607.05/0.00/0.00) lat (ms,95%): 267.41 err/s: 0.00 reconn/s: 0.00
[ 7090s ] thds: 30 tps: 167.67 qps: 1506.13 (r/w/o: 1506.13/0.00/0.00) lat (ms,95%): 282.25 err/s: 0.00 reconn/s: 0.00
[ 7100s ] thds: 30 tps: 170.50 qps: 1535.70 (r/w/o: 1535.70/0.00/0.00) lat (ms,95%): 287.38 err/s: 0.00 reconn/s: 0.00
[ 7110s ] thds: 30 tps: 175.52 qps: 1580.38 (r/w/o: 1580.38/0.00/0.00) lat (ms,95%): 267.41 err/s: 0.00 reconn/s: 0.00

Servers layout
+--------------+---------------+------+--------+---------+
| hostgroup_id | hostname      | port | STATUS | weight  |
+--------------+---------------+------+--------+---------+
| 50           | 192.168.1.22  | 3306 | ONLINE | 100000  |<-- new writer
| 52           | 192.168.1.22  | 3306 | ONLINE | 1000    |
| 52           | 192.168.1.23  | 3306 | ONLINE | 1000    |
| 52           | 192.168.1.233 | 3306 | ONLINE | 1000    |
| 52           | 192.168.1.21  | 3306 | ONLINE | 10      |
| 8050         | 192.168.1.205 | 3306 | ONLINE | 1000000 |
| 8050         | 192.168.1.22  | 3306 | ONLINE | 100000  |
| 8050         | 192.168.1.231 | 3306 | ONLINE | 100000  |
| 9052         | 192.168.1.205 | 3306 | ONLINE | 1000    |<-- node in special hg
| 9052         | 192.168.1.231 | 3306 | ONLINE | 1000    |<-- “
+--------------+---------------+------+--------+---------+
At this point as security feature also if you put back the failed nodes, the script WILL NOT fail back. But I am working on this feature request to implement th eoption to eventually perform fail-back.
As for today if you do:
Set global wsrep_reject_queries=none
On both servers, and you will have:
+--------------+---------------+------+--------+---------+
| hostgroup_id | hostname      | port | STATUS | weight  |
+--------------+---------------+------+--------+---------+
| 50           | 192.168.1.22  | 3306 | ONLINE | 100000  |
| 52           | 192.168.1.205 | 3306 | ONLINE | 1000    |<-- back but READ
| 52           | 192.168.1.22  | 3306 | ONLINE | 1000    |
| 52           | 192.168.1.23  | 3306 | ONLINE | 1000    |
| 52           | 192.168.1.231 | 3306 | ONLINE | 1000    |<-- back but READ
| 52           | 192.168.1.233 | 3306 | ONLINE | 1000    |
| 52           | 192.168.1.21  | 3306 | ONLINE | 10      |
| 8050         | 192.168.1.205 | 3306 | ONLINE | 1000000 |
| 8050         | 192.168.1.22  | 3306 | ONLINE | 100000  |
| 8050         | 192.168.1.231 | 3306 | ONLINE | 100000  |
+--------------+---------------+------+--------+---------+
To fail back you need to manually trigger it.
Connect to the current writer and set it to wsrep_reject_queries = ALL
The script will move back as Writer the node with Higher weight in the 8000 HG
>+--------------+---------------+------+--------+---------+
| hostgroup_id | hostname      | port | STATUS | weight  |
+--------------+---------------+------+--------+---------+
| 50           | 192.168.1.205 | 3306 | ONLINE | 1000000 |<-- back as writer
| 52           | 192.168.1.205 | 3306 | ONLINE | 1000    |
| 52           | 192.168.1.23  | 3306 | ONLINE | 1000    |
| 52           | 192.168.1.231 | 3306 | ONLINE | 1000    |
| 52           | 192.168.1.233 | 3306 | ONLINE | 1000    |
| 52           | 192.168.1.21  | 3306 | ONLINE | 10      |
| 8050         | 192.168.1.205 | 3306 | ONLINE | 1000000 |
| 8050         | 192.168.1.22  | 3306 | ONLINE | 100000  |
| 8050         | 192.168.1.231 | 3306 | ONLINE | 100000  |
| 9052         | 192.168.1.22  | 3306 | ONLINE | 1000    |<-- set as special group
+--------------+---------------+------+--------+---------+
Server crash
In case of server crash the behaviour will be exactly the same with the difference that the node will be elected immediately, no intermediate step for the HG shift.
Killing the mysqld with kill -9 (SIGKILL) will result in the following:
writes
[ 240s ] thds: 10 tps: 42.80 qps: 642.78 (r/w/o: 385.99/166.00/90.80) lat (ms,95%): 331.91 err/s: 0.00 reconn/s: 0.00
[ 250s ] thds: 10 tps: 40.80 qps: 603.37 (r/w/o: 361.74/155.92/85.71) lat (ms,95%): 363.18 err/s: 0.00 reconn/s: 0.00
[ 260s ] thds: 10 tps: 39.60 qps: 600.79 (r/w/o: 361.20/156.20/83.40) lat (ms,95%): 376.49 err/s: 0.00 reconn/s: 0.00
[ 270s ] thds: 10 tps: 35.00 qps: 541.33 (r/w/o: 324.82/141.91/74.60) lat (ms,95%): 356.70 err/s: 0.00 reconn/s: 1.00<--
[ 280s ] thds: 10 tps: 14.80 qps: 216.47 (r/w/o: 130.78/54.89/30.80) lat (ms,95%): 7615.89 err/s: 0.00 reconn/s: 0.00
[ 290s ] thds: 10 tps: 23.10 qps: 347.64 (r/w/o: 208.42/91.21/48.00) lat (ms,95%): 682.06 err/s: 0.00 reconn/s: 0.00</pre><br>

reads
[ 230s ] thds: 30 tps: 253.27 qps: 2281.51 (r/w/o: 2281.51/0.00/0.00) lat (ms,95%): 193.38 err/s: 0.00 reconn/s: 0.00
[ 240s ] thds: 30 tps: 229.80 qps: 2066.20 (r/w/o: 2066.20/0.00/0.00) lat (ms,95%): 215.44 err/s: 0.00 reconn/s: 0.00
[ 250s ] thds: 30 tps: 217.51 qps: 1957.59 (r/w/o: 1957.59/0.00/0.00) lat (ms,95%): 240.02 err/s: 0.00 reconn/s: 0.00
[ 260s ] thds: 30 tps: 207.89 qps: 1872.62 (r/w/o: 1872.62/0.00/0.00) lat (ms,95%): 240.02 err/s: 0.00 reconn/s: 0.00
[ 270s ] thds: 30 tps: 200.18 qps: 1802.03 (r/w/o: 1802.03/0.00/0.00) lat (ms,95%): 253.35 err/s: 0.00 reconn/s: 0.00<--
[ 280s ] thds: 30 tps: 199.33 qps: 1791.80 (r/w/o: 1791.80/0.00/0.00) lat (ms,95%): 240.02 err/s: 0.00 reconn/s: 0.00
[ 290s ] thds: 30 tps: 187.49 qps: 1689.78 (r/w/o: 1689.78/0.00/0.00) lat (ms,95%): 257.95 err/s: 0.00 reconn/s: 0.00

Script Log:
2017/11/16 10:02:10.923:[ERROR] Cannot connect TO DBI:mysql:host=192.168.1.205;port=3306 AS monitor
2017/11/16 10:02:11.179:[WARN] Fail-over IN action USING Method = 1
2017/11/16 10:02:11.179:[INFO] Special Backup - GROUP found! I am electing a node TO writer following the indications
 This Node Try TO become the new WRITER FOR HG 50 Server details: 192.168.1.231:3306:HG8050
2017/11/16 10:02:11.179:[INFO] This Node Try TO become a WRITER promoting TO HG 50 192.168.1.231:3306:HG 8050
2017/11/16 10:02:11.234:[WARN]  Move node:192.168.1.231:33061000002000 SQL:INSERT INTO mysql_servers (hostname,hostgroup_id,port,weight,max_connections) VALUES ('192.168.1.231',50,3306,100000,2000);
2017/11/16 10:02:13.190:[ERROR] Cannot connect TO DBI:mysql:host=192.168.1.205;port=3306 AS monitor

Server layout:
(admin@127.0.0.1) [main]>select hostgroup_id,hostname,port,STATUS,weight FROM runtime_mysql_servers ORDER BY hostgroup_id,weight DESC;
+--------------+---------------+------+---------+---------+
| hostgroup_id | hostname      | port | STATUS  | weight  |
+--------------+---------------+------+---------+---------+
| 50           | 192.168.1.231 | 3306 | ONLINE  | 100000  |<-- new writer
| 52           | 192.168.1.205 | 3306 | SHUNNED | 1000    |<--shunned server
| 52           | 192.168.1.22  | 3306 | ONLINE  | 1000    |
| 52           | 192.168.1.23  | 3306 | ONLINE  | 1000    |
| 52           | 192.168.1.231 | 3306 | ONLINE  | 1000    |
| 52           | 192.168.1.233 | 3306 | ONLINE  | 1000    |
| 52           | 192.168.1.21  | 3306 | ONLINE  | 10      |
| 8050         | 192.168.1.205 | 3306 | SHUNNED | 1000000 |
| 8050         | 192.168.1.22  | 3306 | ONLINE  | 100000  |
| 8050         | 192.168.1.231 | 3306 | ONLINE  | 100000  |
+--------------+---------------+------+---------+---------+
Using Auto_failover=2|3
This is going to be exactly the same behaviour not matter what is the failover method choose.
The most flexible and controlled one is to use the 8000 HG with the identification of the list of servers prioritize by weight.
The use of pxc_cluster_view, will give you an pseudo automatic way to set the same priority.
But choosing that method will NOT guarantee you that the node you want will take the traffic given is based the internal Galera decision.
Conclusions
While the galera_check script was initially conceptualize to work with multiple writers, the inclusion of pxc_cluste_view and the addition of the special Host Group 8000, had provide the needed base for me to develop a sustainable feature to support single writer and failover.
I have to remember you that the preferred solution is and remain to use multiple writers with different weights, given that solution provide internal failover in Proxysql.
The use of active_failover can significantly reduce the amount of service interruption caused by a possible single writer node crash, still it is an external script and is not a effective as internal balancing base on weight.
By design the script at the moment is NOT supporting the failback, but I already have a feature request on this.
Once implemented this feature will allow a node that had being removed from the active pool, to recover his state once in a healthy state again.
Another very important aspect is the way ProxySQL will manage the configuration cross node using the cluster option.
This will be described in the next article.
More blogs (shorter) will come on how to use the script and ProxySQL Cluster.
Reference
https://github.com/Tusamarco/proxy_sql_tools
https://www.percona.com/blog/2016/09/15/proxysql-percona-cluster-galera-integration/

 Not long ago we had an internal discussion about security and how to enforce a stricter set of rules to prevent malicious acts, and block other undesired queries.
 Story ... click me